Bitcoin Lingers Below Key Levels As ETF Appetite Dwindles: Bitfinex Alpha 🖤🕸️

Bitcoin’s kinda stuck trading near $84,000 rn after yet another flop trying to smash past its yearly open at $87,700. Bitfinex is saying the next big move hinges way more on fresh spot buying than some futures leverage pump fr.

Futures Leverage Crashing As Demand Cools 🖤

Bitcoin hit $87,200 back on October 2 before sliding under that key line. This rejection marks the third failed breakout in just ten days 💀. The real question now is if it can actually flip the trend tho.
Futures action pumped the whole thing with open interest jumping $2.1 billion before the September payrolls report. Then futures open interest dropped $1.5 billion as traders bailed after the data ✨. Aggregate futures open interest sits at about 625,000 BTC now, the lowest since January 1. That drop screams lower leverage overall 🦇.
Spot demand is fading too with US spot Bitcoin ETFs pulling just $241.1 million in net inflows from September 28 to October 2. That’s roughly 90% below the $2.39 billion from the week before 🌙. The nine-day inflow streak even snapped on September 30 with a $148.7 million outflow 🕸️.

ETF Flows And Those Make-Or-Break Levels 🔥

BlackRock’s IBIT grabbed $450.2 million while Fidelity’s FBTC saw $168 million flow out. Bitfinex pins the weaker vibe partly on the average ETF holder’s cost basis sitting around $84,320 📉. ETF inflows average about $65 million when Bitcoin trades within 2% of that level but jump to $136 million when it’s over 10% above 🪙. Bitfinex eyes $86,000 as a solid line while a dip under $82,600 could shove ETF holders back into losses 🌑.
Beyond the ETF noise the $84,000 to $84,500 zone holds roughly 867,000 BTC and it’s the biggest cost-basis cluster with about 75% of Bitcoin supply still in profit. Weak payroll growth is sparking October rate pause hopes even if inflation spending and Treasury yields stay elevated lol. Bitfinex expects BTC to consolidate between $84,000 and the yearly open. Stronger ETF inflows could push toward $90,000 while sustained trading under $81,300 might drag things to $77,000 and the True Market Mean near $77,200 into focus 🦇.


Just another echo from the void by iconofsin.eth 💖


Maybe you like what i'm doing here and wanna support me via the ethereum blockchain: iconofsin.eth 💖

LINK Climbed 24% Lately Yet This Core Metric’s Lying Dormant 🕸️🦇

LINK has totally blasted up by about 24% since the start of September but fresh wallet numbers are basically flat according to Santiment data rn.

The Good And The Bad Vibes 😈

Analysts over at Santiment noticed Chainlink pulled in around 1,249 fresh addresses daily over the past four weeks ending October 6 versus 1,225 before September 1. That is less than a 2% bump even while the token itself surged almost 25% in the same window. It is wild compared with Solana where new addresses jumped 33% alongside a 20% price run. Ethereum stayed pretty flat like LINK but ETH only gained a modest 11% during that stretch. Remember this metric only tracks LINK on Ethereum mainnet and misses anything bridged via CCIP plus holdings in ETFs tho. Chainlink has dropped tons of hype and price vibes yet new on-chain wallets have not really exploded at all. The count of non-empty LINK wallets slipped down to 912,020 right as the price hit a multi-month peak above $15 which means some smaller holders cashed out profits along the way.

LINK Takes A Slide Down 📉

LINK got rejected hard at $15.80 and the past day has been rough with the token dropping to $13.40 now. Besides the overall market dip another reason popped up from on-chain lens showing GSR moved another 303,010 LINK straight to Binance after grabbing them from a Gnosis Safe. That marks the second big transfer in recent days pushing the total past 578,000 LINK worth roughly $8.25 million. Moves like these can crank up immediate sell pressure fast.
Just another echo from the void by iconofsin.eth 💖
Maybe you like what i'm doing here and wanna support me via the ethereum blockchain: iconofsin.eth 💖

BTC’s Drop Below 84K Unveils DeFi’s Next Enigmatic Moves 🖤🌙

Bitcoin’s chilling below 84K rn after that flop toward 90K territory. The bigger picture stays kinda solid tho but this dip plus those weak futures screams consolidation vibes before any fresh breakout attempt.

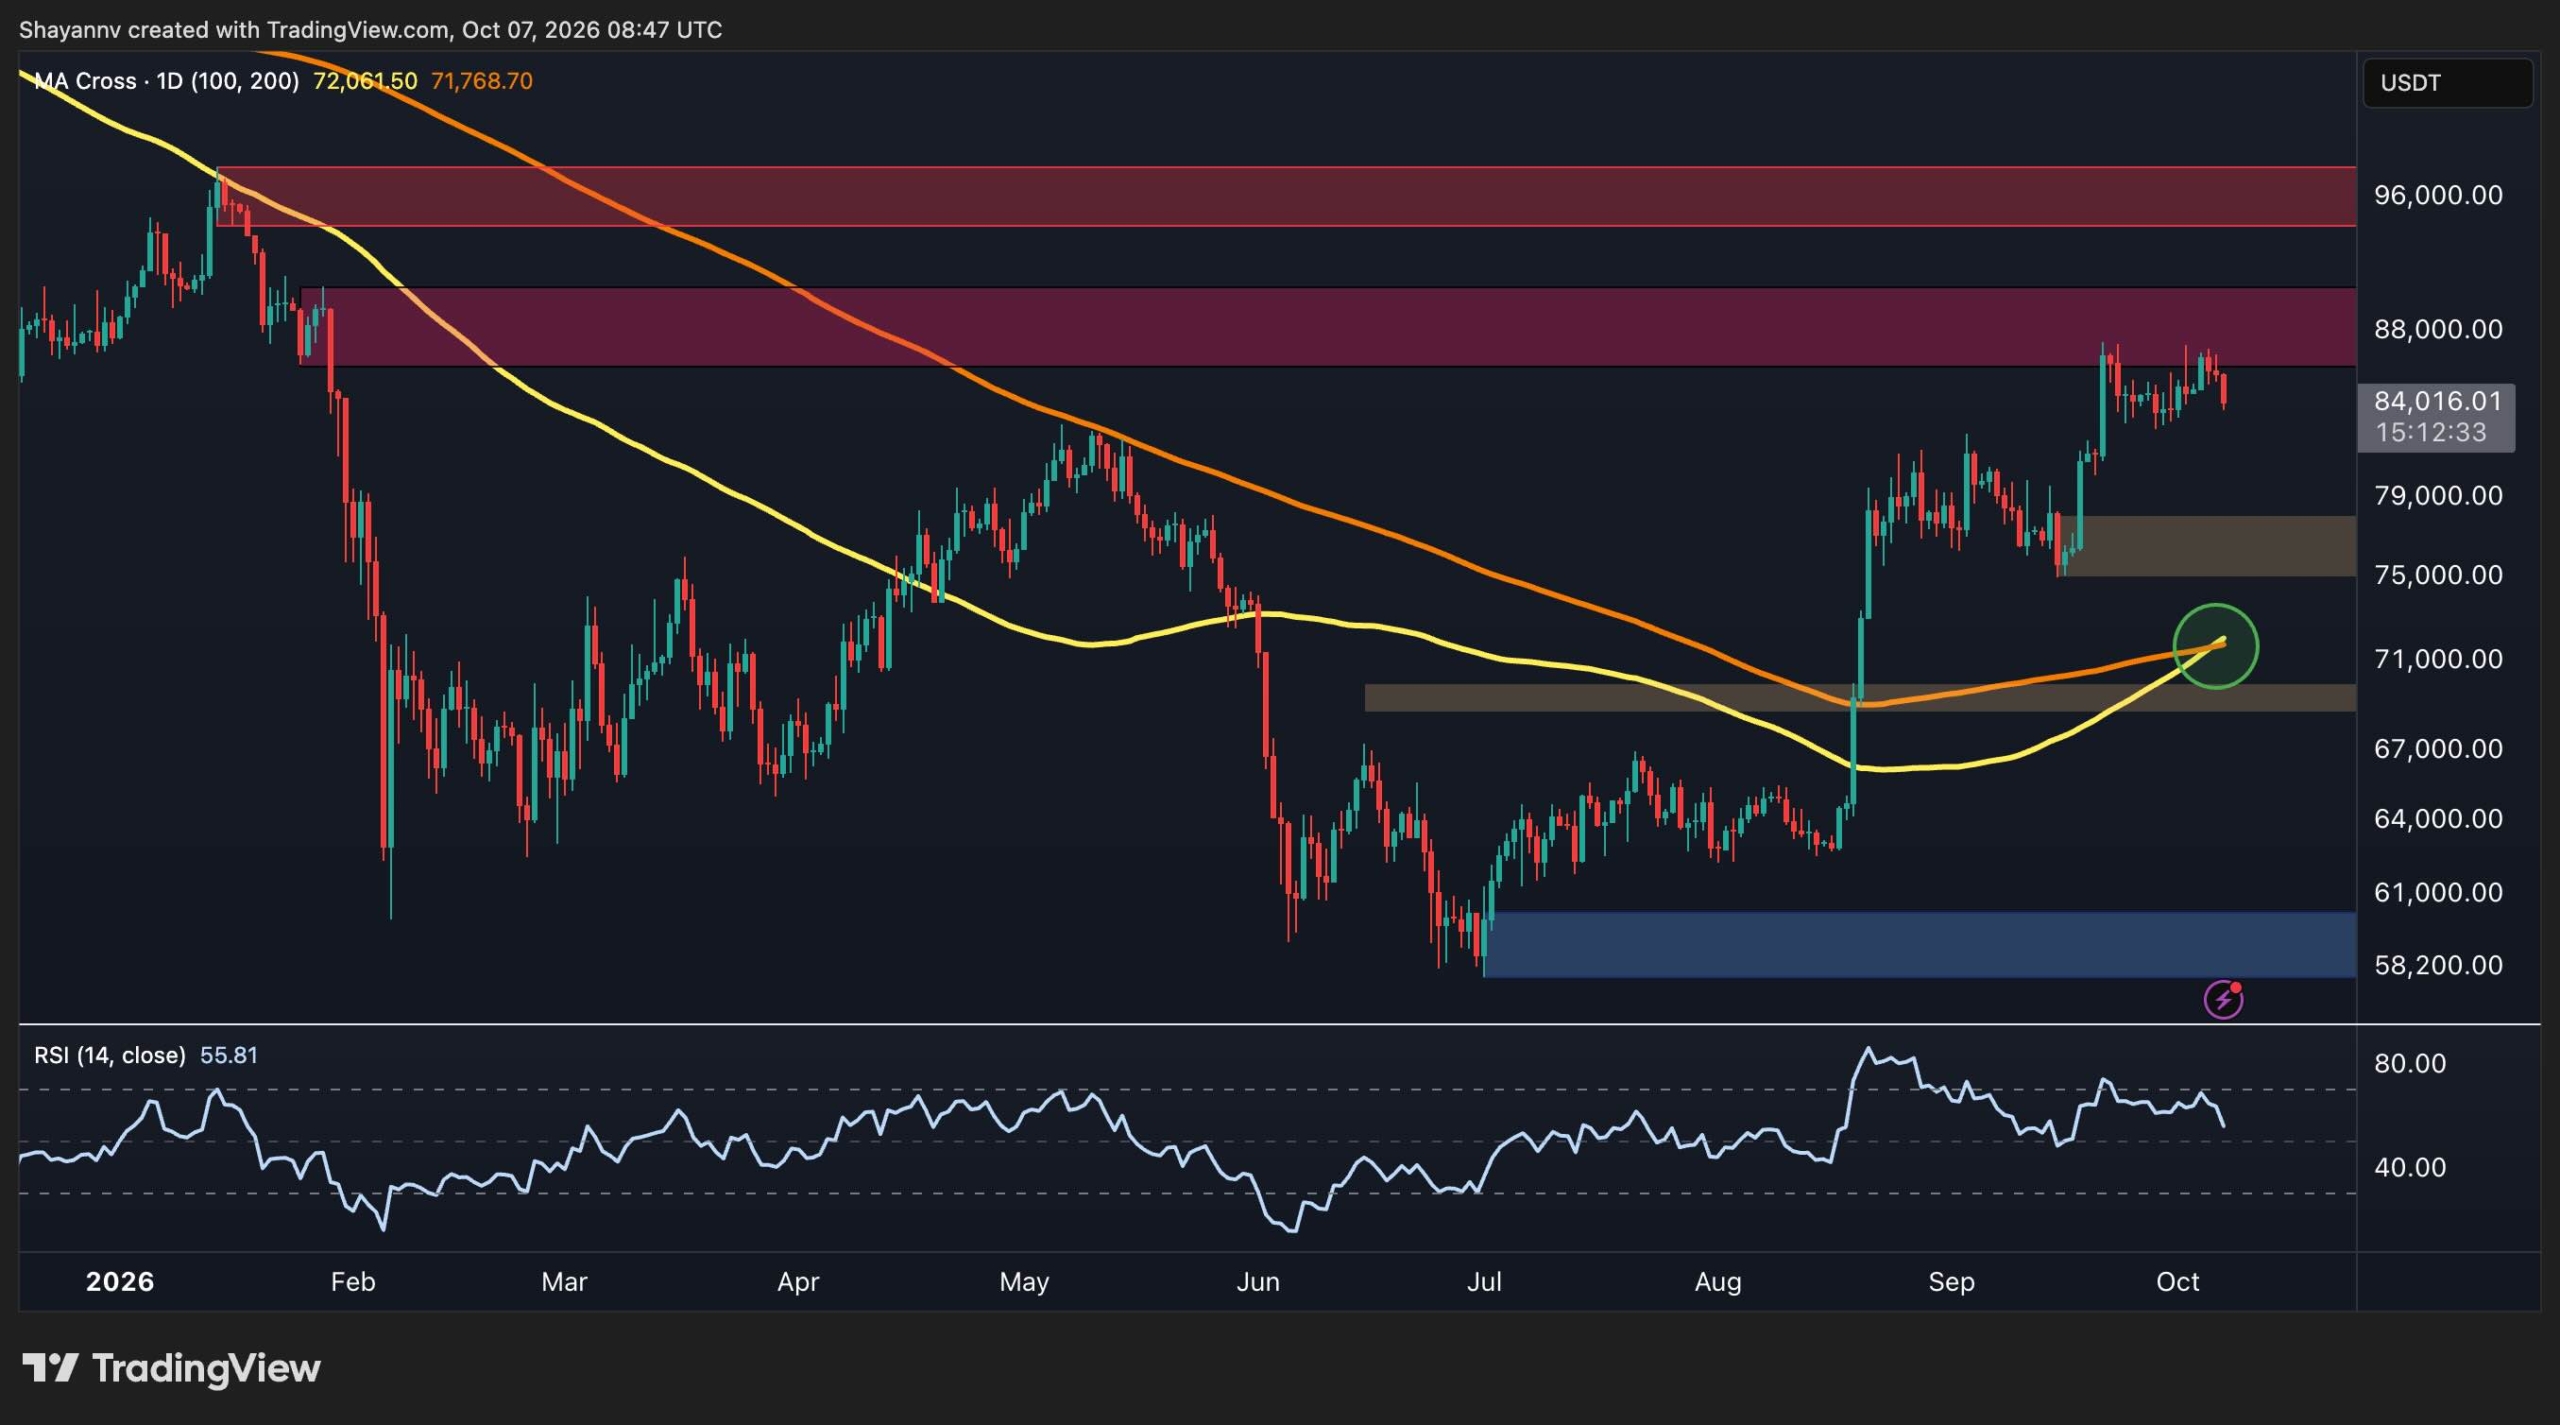
Daily Chart Glow Up With A Side Of Caution 🖤

The daily setup shows major structure gains over recent months. BTC already snatched back both the 100-day and 200-day moving averages sitting near 72K. Those averages even converged while the shorter one flipped higher which could lock in the longer trend even more.

Price also smashed above 75K which now acts like key demand. Holding here keeps the higher lows alive and the bullish recovery intact. A slide toward 70K would still leave the overall trend positive but losing that zone would hurt the setup bad.

Upside faces heavy supply near 88K where closes keep failing. A real breakout tho would open the door to 96K next. Momentum feels good but cooled with daily RSI above 50 and tons of room before overbought. No major top exhaustion showing yet.

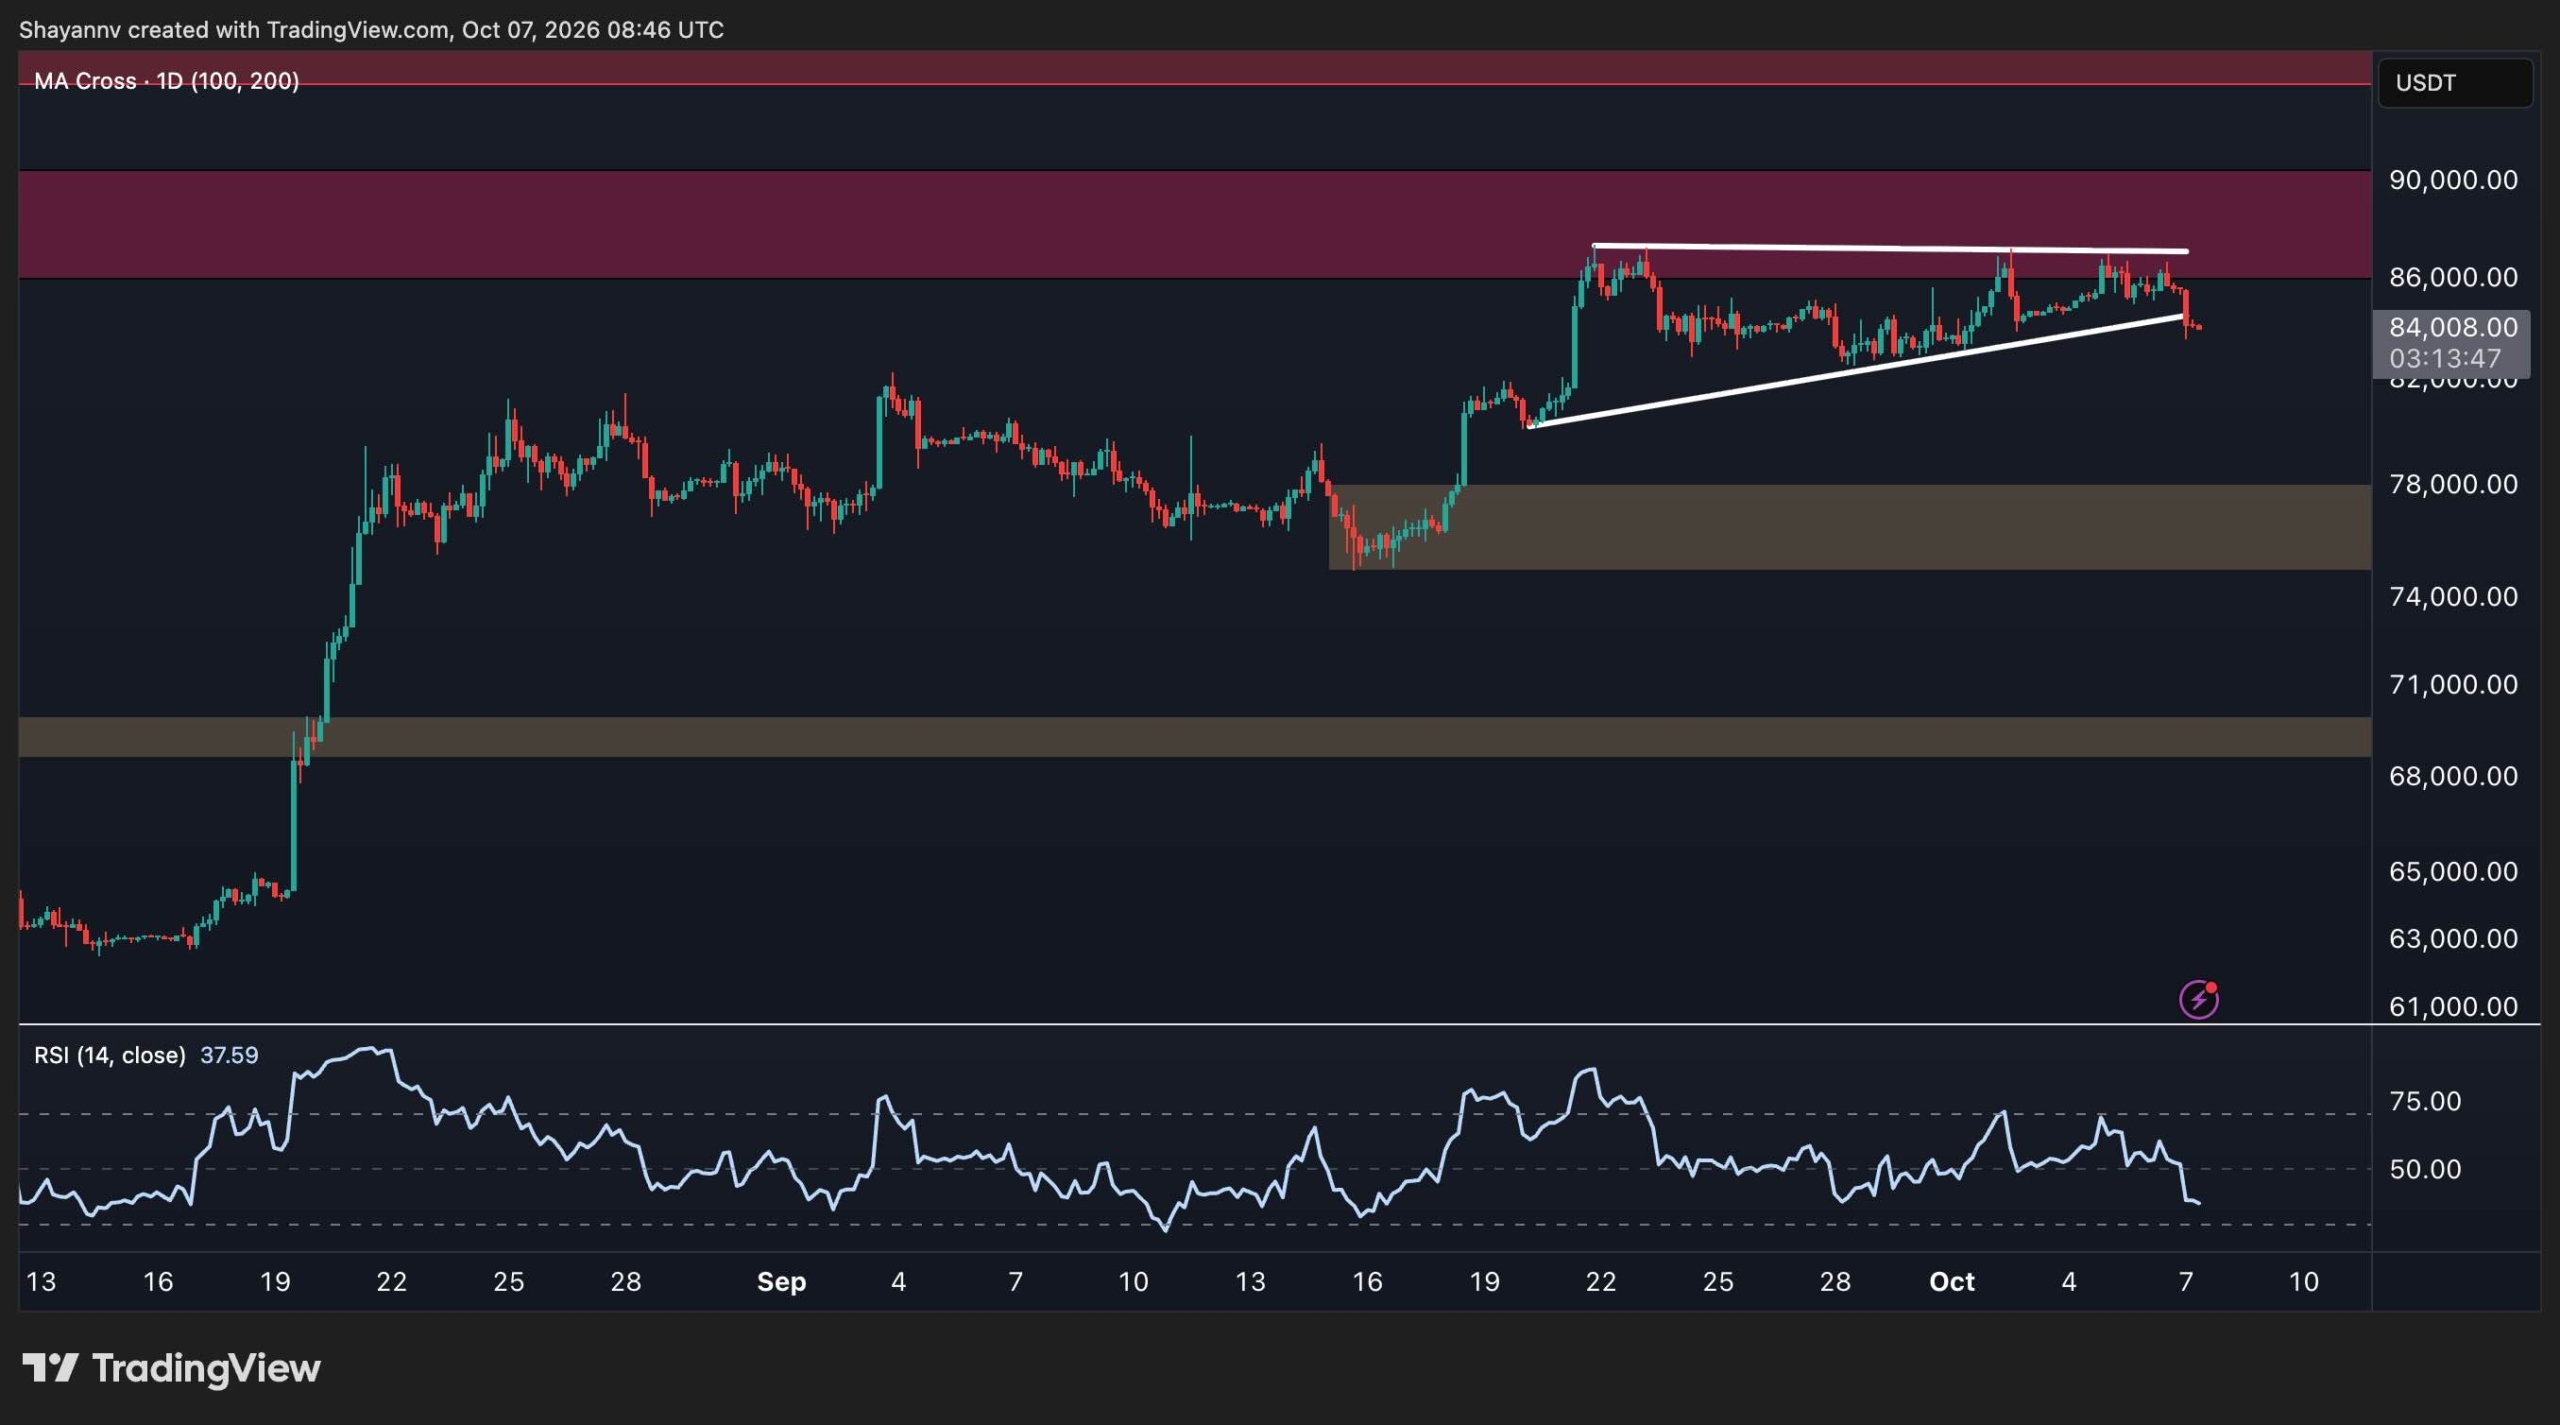
4H Chart Turning A Bit Wobbly 📉

The 4H view looks more cautious. BTC built an ascending triangle from September lows with multiple holds but price just cracked that trendline and slid to 84K.

That 84K zone matters right now. Buyers grabbing it back plus restoring the line could turn the drop into a quick shakeout. Then BTC might eye 88K resistance again and push for a clean breakout.

A firm break under 84K tho raises odds of a deeper slide to 75K-78K where prior breakout support sits. The 4H RSI crashed to 38 showing short term momentum fading toward oversold which might spark a bounce but alone it doesn’t flip the script.

Taker Ratio Sending Shady Signals 💀

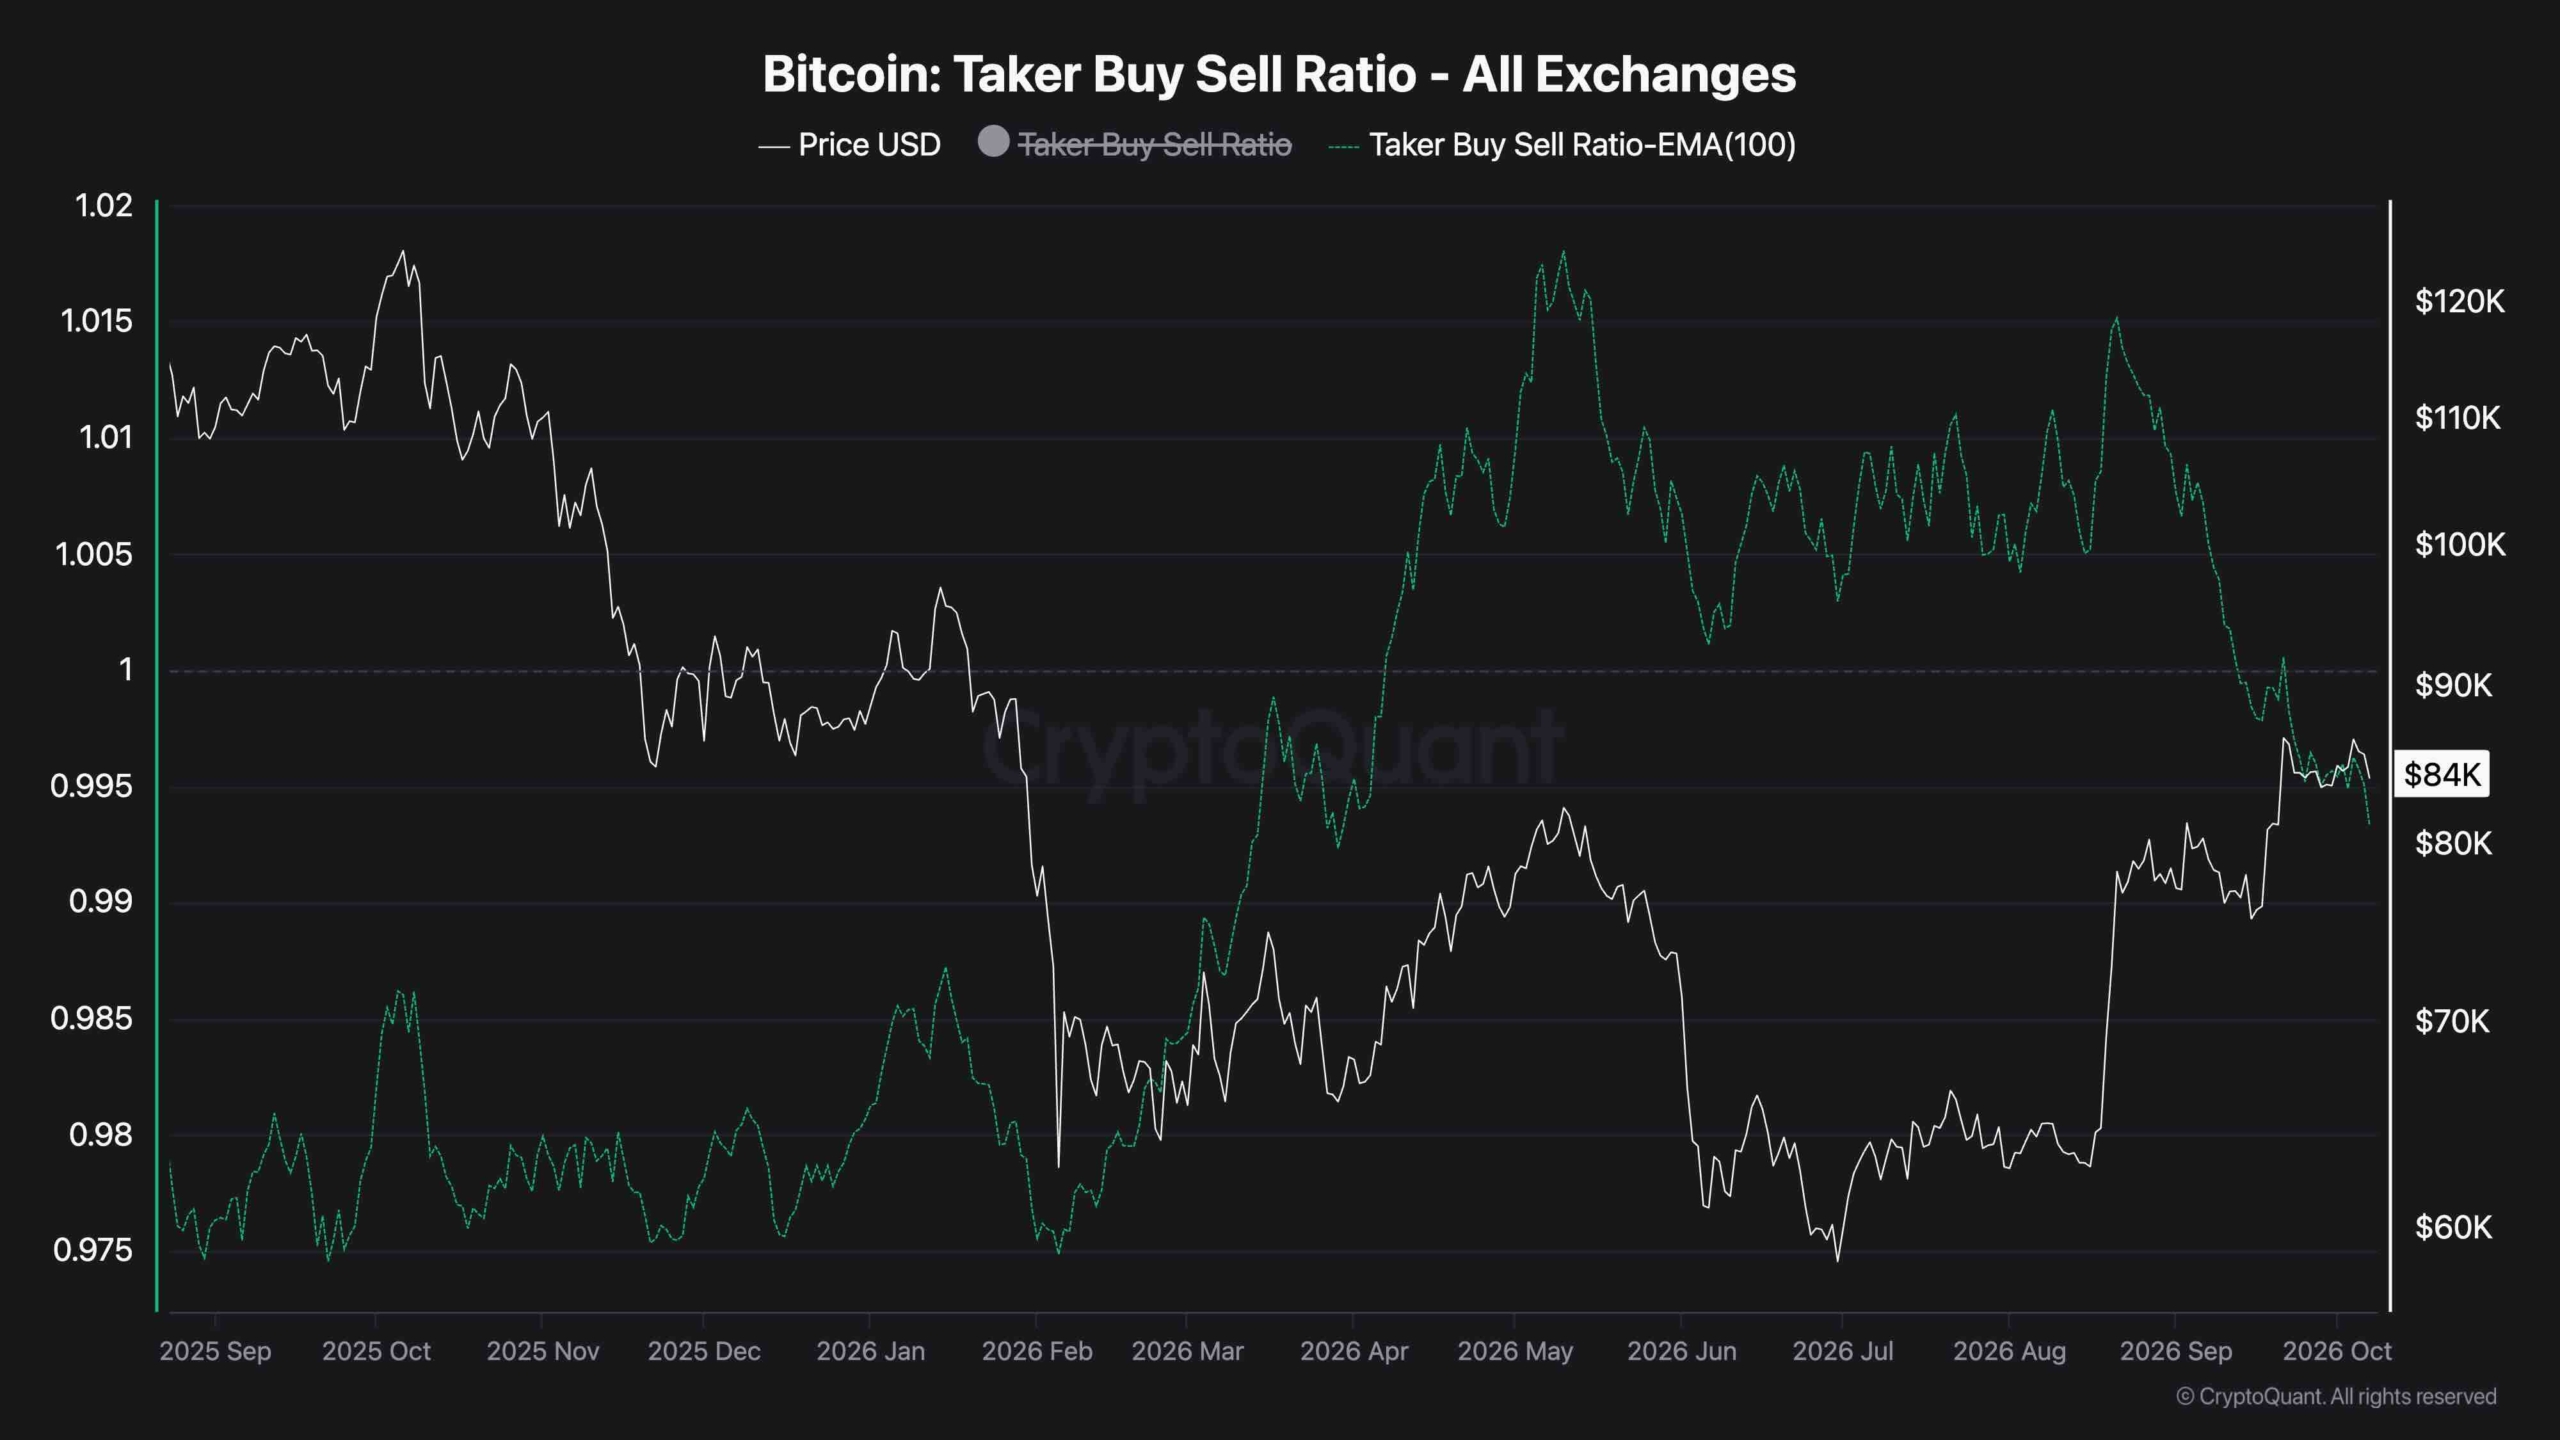
The taker buy sell ratio is flashing a warning. It tracks aggressive buying versus selling with above 1 meaning buyers dominate and below 1 showing sellers winning.

Latest read dipped under 1 to 0.994 down hard from September highs. That means aggressive buying faded as price tested 88K resistance. Even worse the ratio trended lower since August peak while BTC stayed elevated creating a divergence that says the latest run lacked steady futures demand.

Doesn’t mean instant reversal but it makes a clean 88K break less believable unless the ratio recovers. A move back above 1 plus price breakout would confirm buyers back in charge.

😈 🌑 🦇 🕸️ 🕷️ 📈 💉 🪦


Just another echo from the void by iconofsin.eth 💖


Maybe you like what i'm doing here and wanna support me via the ethereum blockchain: iconofsin.eth 💖

24,000 BTC Just Ghosted Exchanges, Is Bitcoin’s Supply Squeeze Getting Real? 🦇🌑

Bitcoin held on exchanges dropped a ton lately, according to Santiment. On Monday around 24,073 units left exchanges on a net basis. This marks the biggest daily outflow in seven months.

Spooky Fresh Bullish Vibes Rising 💀

The last similar move happened on March 1. Data from Santiment showed that exchange-held Bitcoin has now fallen to around 6.50% of the total supply. Large outflows often scream positive because fewer coins sit ready for dumping. If demand holds steady tighter supply could push prices higher. The analytics platform added,

“Persistent withdrawals can signal investors shifting BTC toward longer-term custody rather than preparing to sell. Outflows alone guarantee nothing but falling exchange supply strengthens the bullish setup.”

CryptoQuant data adds more bullish flavor. Its analysis showed mid-size Bitcoin inflows fell on some major exchanges even as the crypto asset climbed over 33% since mid-August. On Binance the 7-day average of mid-size inflows fell from 4,155 BTC on August 16 to 2,648 units on October 7 a decline of over 36%. Bitcoin was trading near $63,000 in mid-August and is now above $84,000. This means the drop arrived even as price stayed on the higher side. Coinbase Prime also saw a similar decline with mid-size inflows falling from 1,620 to 1,370 BTC down around 15%. Coinbase Advanced on the other hand moved opposite. Mid-size inflows there rose to 4,760 from 2,520 BTC in August. Yet the latest reading stays below the 5,000 BTC level. Current mid-size inflows on Binance and Coinbase Prime sit well below some bigger spikes earlier this year including those in February June and late August. The trend matters because lower exchange inflows can hint at less selling activity. Mid-size investors do not appear rushing to send coins to exchanges.

ETF Flows Flipping Positive Again 🖤

On the institutional side US spot Bitcoin ETFs saw a quick mood shift this week. After starting Monday with almost $90 million in net outflows the funds bounced back on Tuesday with combined inflows of $119 million. BlackRock’s IBIT led the recovery after pulling in $122 million in fresh money and recording the biggest inflow among the ETFs. Morgan Stanley’s MSBT also attracted $7.84 million in capital. Meanwhile the Grayscale Bitcoin Mini Trust saw the biggest outflow losing around $11 million. This supply crunch feels super sinister in the cutest way fr 👀 🚀 💸 😈 🌙 🔥 ✨ 😎
Just another echo from the void by iconofsin.eth 💖
Maybe you like what i'm doing here and wanna support me via the ethereum blockchain: iconofsin.eth 💖