Cysic Lures Traders Toward A Fresh Peak After Upbit Listing 🖤🌙

Cysic Lures Traders Toward A Fresh Peak After Upbit Listing 🖤🌙

Even when most major cryptocurrencies stay eerily flatlined every big swing from smaller-cap alts turns into instant buzz. Today’s spotlight lands on Cysic’s CYS 🖤
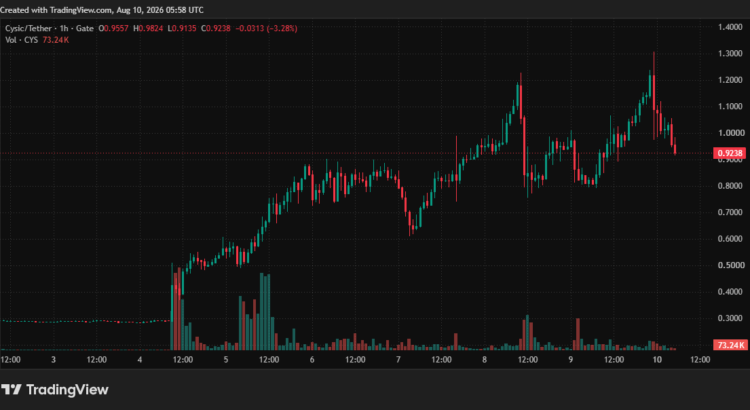
The token blasted over 60% from its low at 0.8 yesterday straight to a fresh all-time high of 1.30 before snapping back south to 0.92 at press time. A major catalyst came from that sudden listing on South Korea’s powerhouse exchange Upbit 🌙

CYS Price Action Unraveled 📈
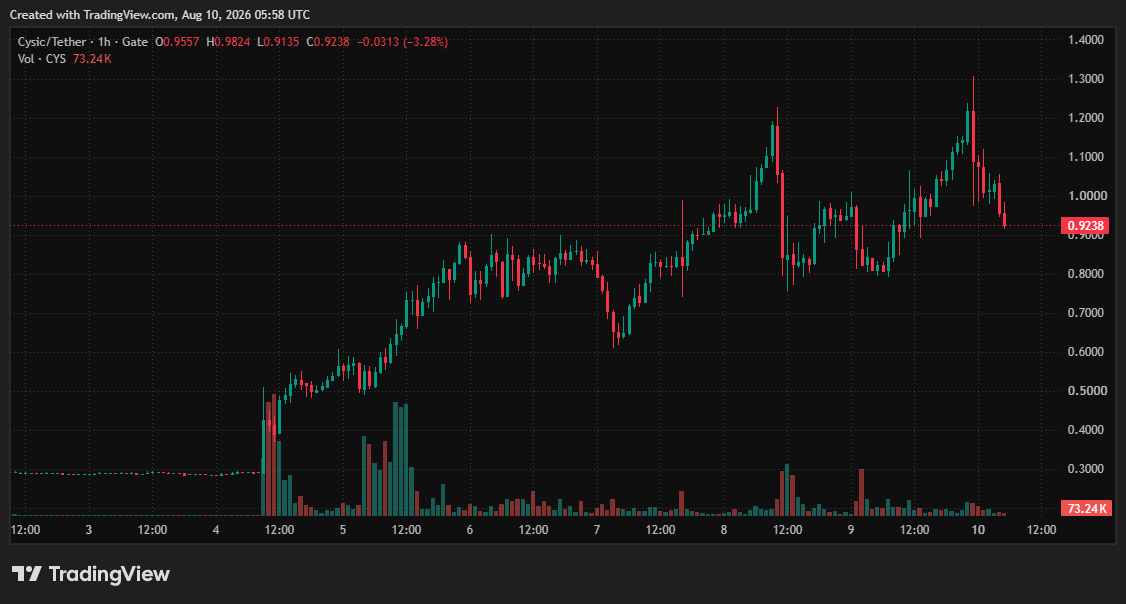
CYS/USDT. Source: TradingView

The spooky timing of the surge stands out the biggest wick in the last 12 hours hit at 23:00 UTC on August 9 when price kissed 1.30 🔮
Yet the real Upbit announcement on X only dropped hours later past 03:00 UTC on August 10.

Trading on BTC and USDT pairs kicked off at 14:00 KST or 05:00 UTC which stirred plenty of side-eye across Crypto X over possible insider whispers 👀
Still the classic pump-and-dump reality hit hard and the token powering that decentralized ComputeFi build ended up among today’s wildest movers in an otherwise sleepy market 💥
Upbit listings keep their reputation for triggering quick pops followed by sharp pullbacks just like when they added B3 the Layer-3 token on Base earlier this year driving it up triple digits to 0.0021 🔄
Right now that same asset sits roughly 80% under its local high grinding below 0.00045 on CoinGecko 🕸️


Just another echo from the void by iconofsin.eth 💖


Maybe you like what i'm doing here and wanna support me via the ethereum blockchain: iconofsin.eth 💖

Ethereum Keeps Its RWA Crown While Solana’s DeFi Grip Tightens 🖤💀

Ethereum maintains its firm hold over the tokenized real-world asset scene while Solana builds real spot trading flows as the lone serious contender per the latest CoinShares and Token Terminal joint report 🖤. Other big chains like Arbitrum BNB Chain and Base still lack any notable RWA spot action even after years online.

Dominant Networks Prevail 🌙

Liquidity stays locked on these veteran ecosystems where issuers and market makers already enjoy live venues so newer chains now chase proven DeFi apps too.

RWA Borrowing Gains Momentum 🔮

Crypto-native trade volumes dropped sharply over the past year while RWA spot trade instead climbed about 220% year over year from a tiny base between Q2 2025 and Q2 2026 even as overall DEX spot volumes slid roughly 70% according to the data. Tokenized assets keep attracting flows on their own terms separate from wider market swings. Total DeFi deposits fell around 15% in the same stretch from withdrawals and softer prices yet RWA deposits on lending venues and decentralized exchanges more than tripled from $2.3 billion to $7.4 billion. This surge shows real utility demand for tokenized collateral rather than pure crypto hype. Ethereum still leads RWA-backed lending with nearly 70% of all such deposits sitting on its platforms making it the main on-chain collateral hub. Plasma sits second thanks to Aave pushing beyond Ethereum while Solana growth rides Kamino a homegrown lending app built for productive RWA uses.


Just another echo from the void by iconofsin.eth 💖

Maybe you like what i'm doing here and wanna support me via the ethereum blockchain: iconofsin.eth 💖

Institutions Creep Deeper Into Crypto As They Drive 72% Of Spot Flow: Report 🖤🐍

Institutions Are Whispering Sweet Volatility Killers Into The Market Now 🖤
This week Wintermute spilled that institutional investors claimed 72% of its spot OTC crypto flow in the first half of 2026 up from 59% a year ago.
Professional investors keep reshaping crypto markets through tight focus on fewer assets heavy use of derivatives and steady muting of those wild price swings that used to define retail trading the firm notes 🌙.
Wintermute’s 1H26 OTC report found that institutional counterparties including hedge funds digital asset treasuries asset managers and family offices accounted for 72% of spot flow on its desk between January and June climbing from 61% in the second half of 2025 and 59% in the first half of 2025.
The company highlighted how institutional activity now carries enough weight to steer market direction and token performance. It noted that institutions stand as the clear drivers of Wintermute’s OTC flow while their habits keep redirecting liquidity across crypto 🕸️.
One striking shift shows institutions locking onto a smaller set of tokens. Between the first half of 2024 and the first half of 2026 unique tokens traded by institutional counterparties rose just 24% while retail traders expanded their set by 76% over the same stretch.
Wintermute added that this pattern forges a market where liquidity clusters tighter in fewer assets. Institutional investors have also shifted deeper into derivatives. Altcoin options notional volume on Wintermute’s desk grew 3.4 times between the second half of 2025 and the first half of 2026 as they leaned on options strategies for yield 💀.
The report ties institutional participation directly to quieter volatility with Bitcoin’s realized volatility sliding from near 70% in 2025 down to about 45% now ✨.
Wintermute CEO Evgeny Gaevoy told Bloomberg Crypto that institutions continue altering crypto behavior as their share of trading grows. The firm wrote As the patient cohort grows it is draining crypto of the volatility that once made the asset class so compelling to retail 🦇.

BTC Bear Market Now Moves In Quiet Shadows 🌹
While the stretched BTC downturn has it down roughly 49% from its October peak above $126,000 last year unlike earlier crypto winters the slide stays relatively steady with fewer sudden extreme plunges. The OG cryptocurrency sat near $65,000 at the time of writing with data from CoinGecko showing barely any move in 24 hours and just 1% gain across seven days.
The report’s findings line up with banks expanding crypto infrastructure this year including Morgan Stanley which announced it would introduce crypto trading on its E*Trade Platform. The asset management firm also recently launched America’s cheapest ETH and SOL ETFs.


Just another echo from the void by iconofsin.eth 💖

Maybe you like what i'm doing here and wanna support me via the ethereum blockchain: iconofsin.eth 💖
Deciphering BTC's Enigmatic Charts: Hints For Next Week's Moves 🦇🌒

Deciphering BTC’s Enigmatic Charts: Hints For Next Week’s Moves 🦇🌒

Bitcoin stays stuck in a wide consolidation zone, with the latest bounce failing to spark real bullish drive. The price edges toward overhead supply again, yet buyers haven’t delivered the breakout for a real structural change. 🕸️

Daily Chart Vibes 🔮

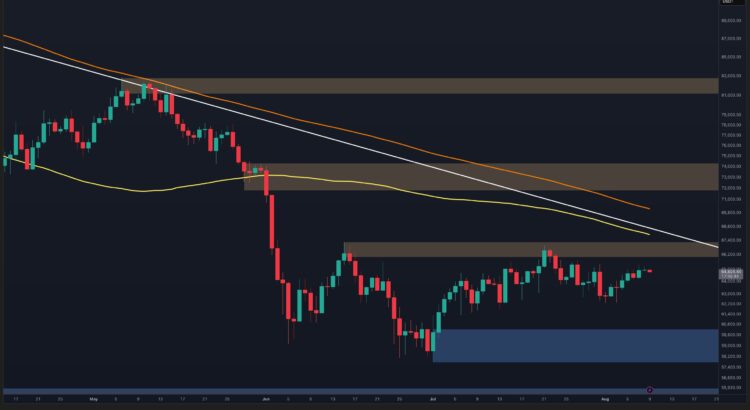
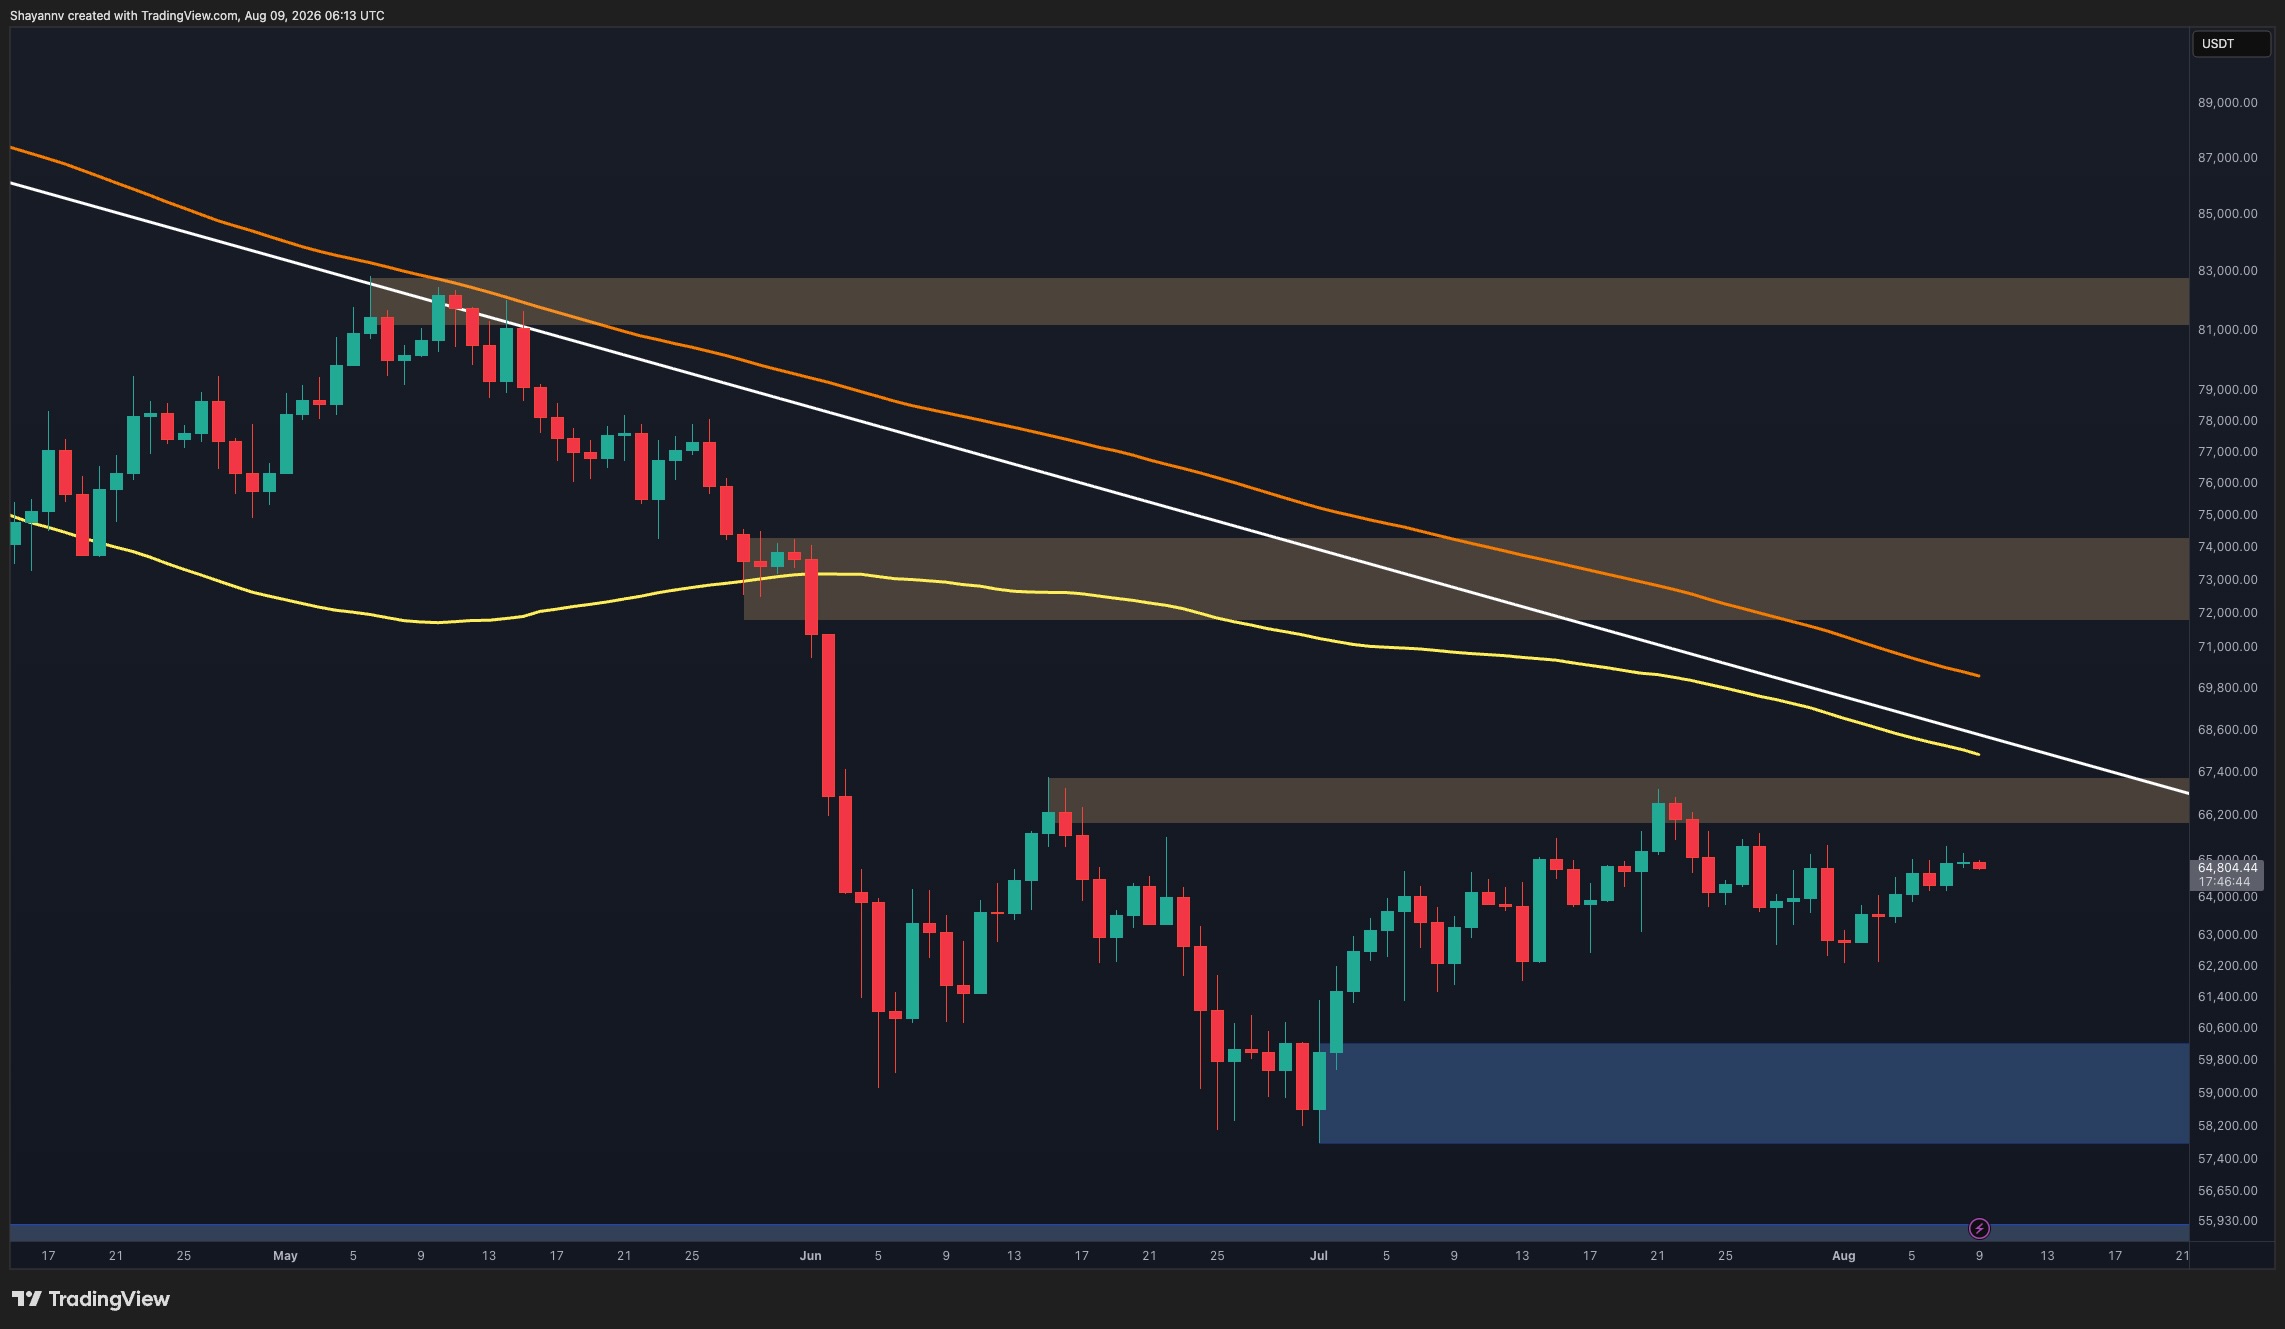
On the daily frame, BTC trades near 65000 after lifting from late June lows. Still the rebound lacks solid bullish push, with recent candles staying tight as price tests the 65800 to 66800 resistance band. This zone already blocked earlier recoveries and now gains extra weight from the falling white trendline. Bitcoin also sits well under declining moving averages, keeping the broader structure tilted bearish even after the pause.

The current lift looks more like quiet holding below resistance than a confirmed reversal. A clean daily break above 65800 to 66800 plus the trendline would brighten the view, while fresh rejection points back to the big 57800 to 60000 demand area.

Hesitant action matches a market waiting on macro and geopolitical updates. Tensions around US Iran and the Strait of Hormuz, plus fresh US inflation figures this month, may trigger volatility. Until a decisive push, Bitcoin could face sharp liquidity swings inside the range.

4 Hour Chart Tension 💀

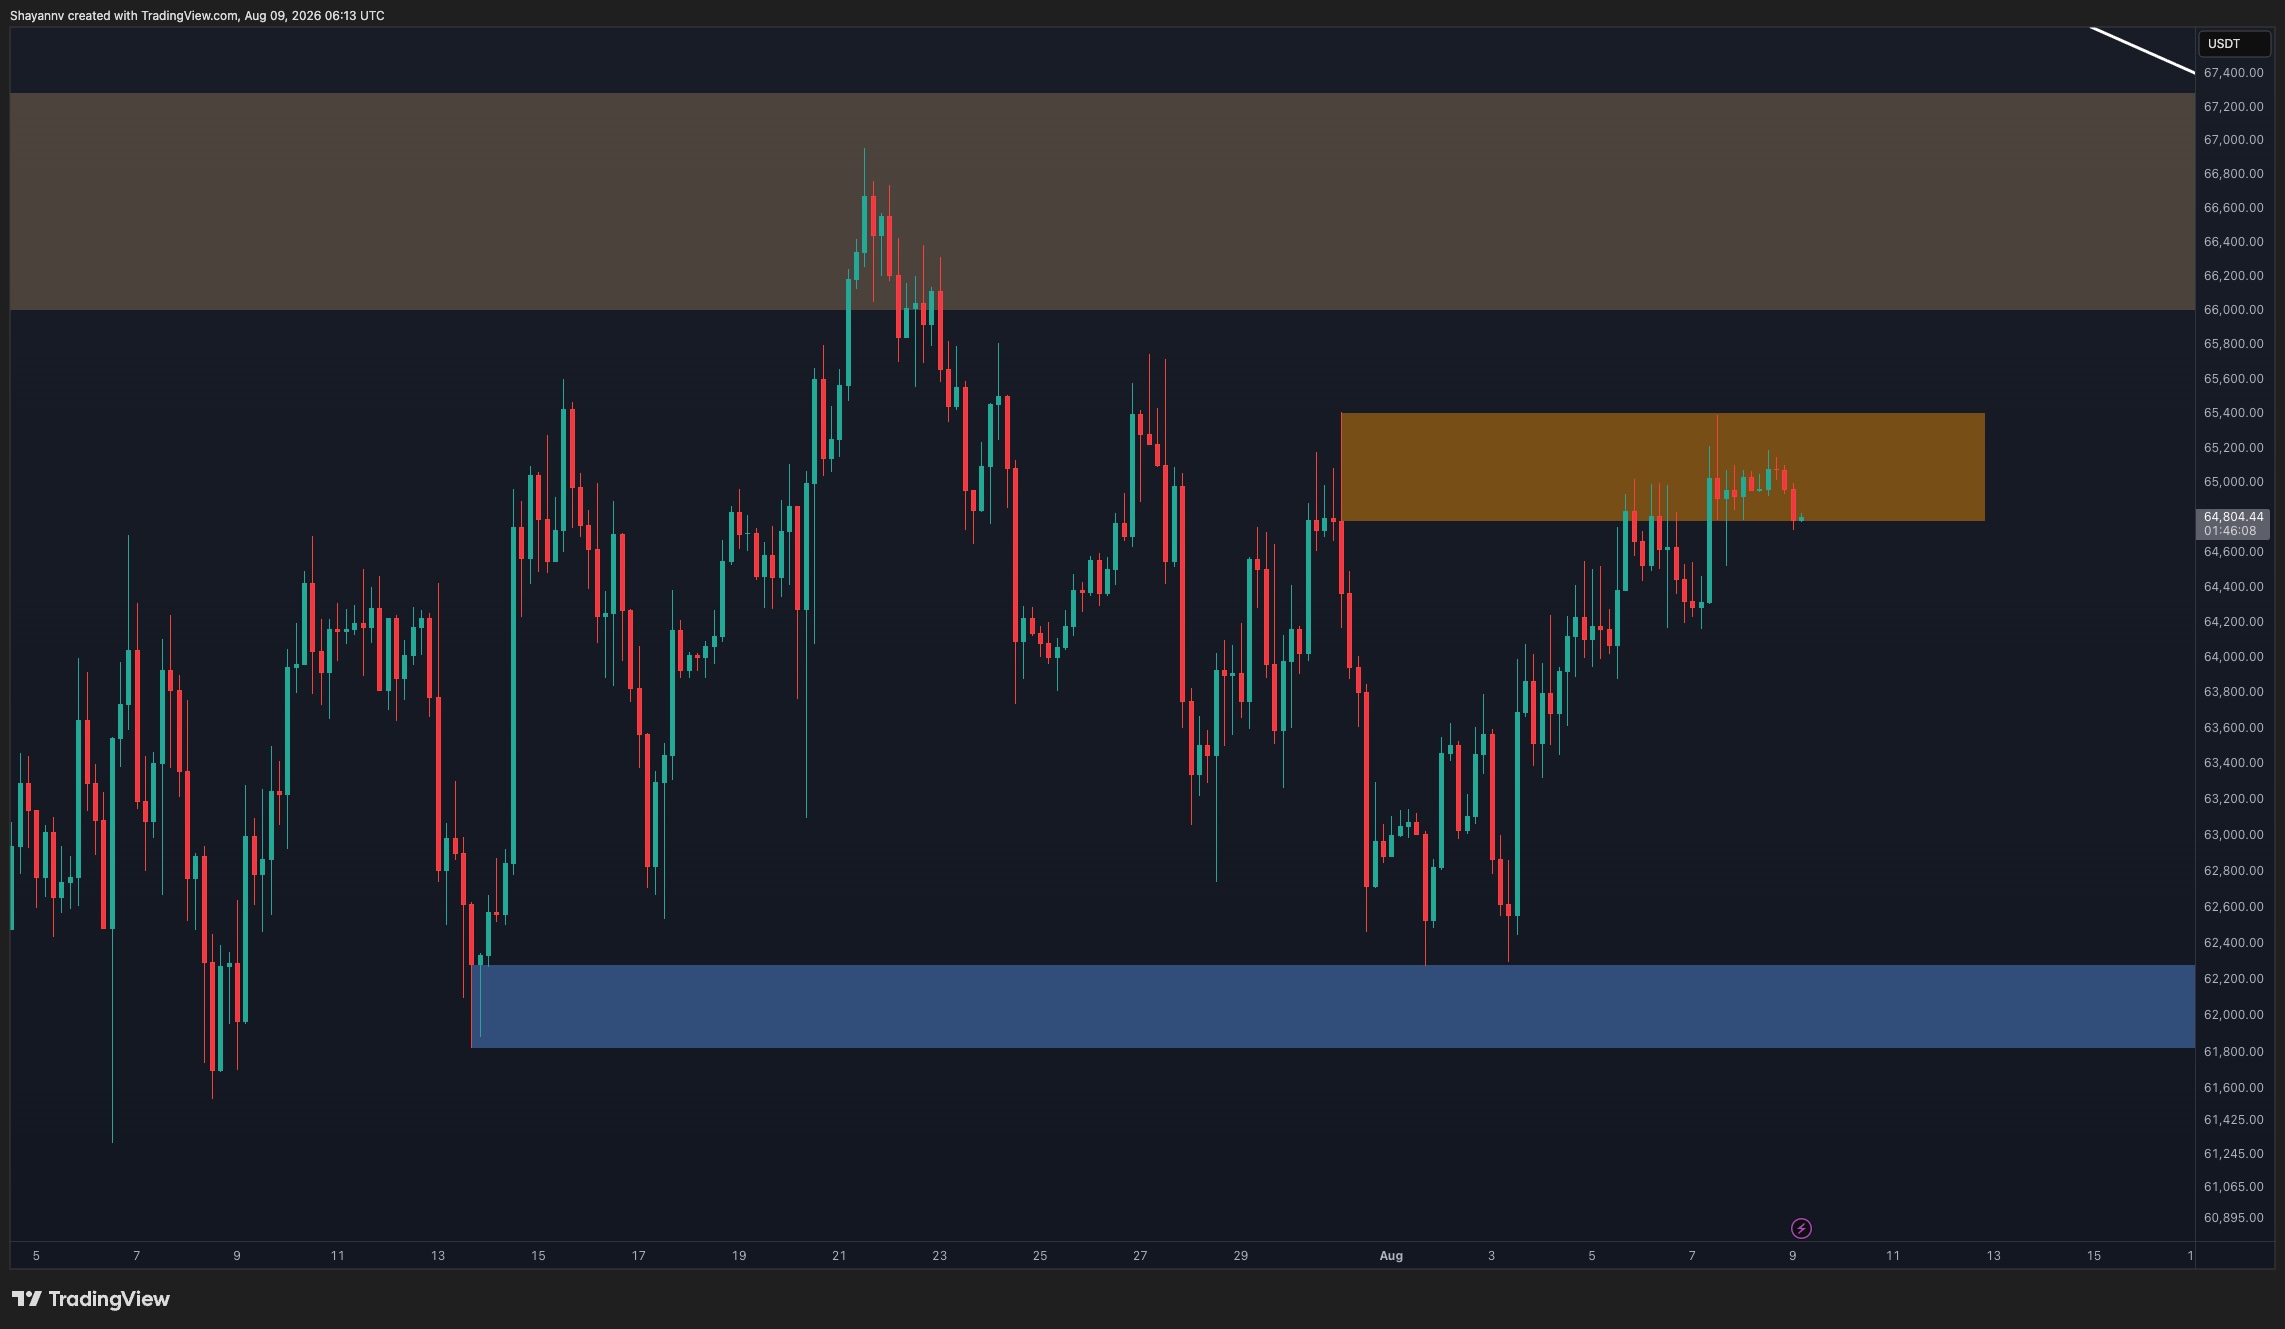
The 4 hour view shows buyer hurdles clearly. BTC climbed from the 61800 to 62300 support area but keeps stalling at the orange supply box near 64800 to 65400. Recent candles cluster at the lower edge of that zone instead of blasting through. Failure to reclaim resistance after the 62000 recovery hints momentum fades near a key line.

Staying below 64800 to 65400 keeps rejection risk alive. Any pullback could unwind gains and retest 61800 to 62300. A firm break and hold above 65400 would ease bearish pressure and open room toward the bigger 65800 to 66800 band.

Onchain Signals 🌑

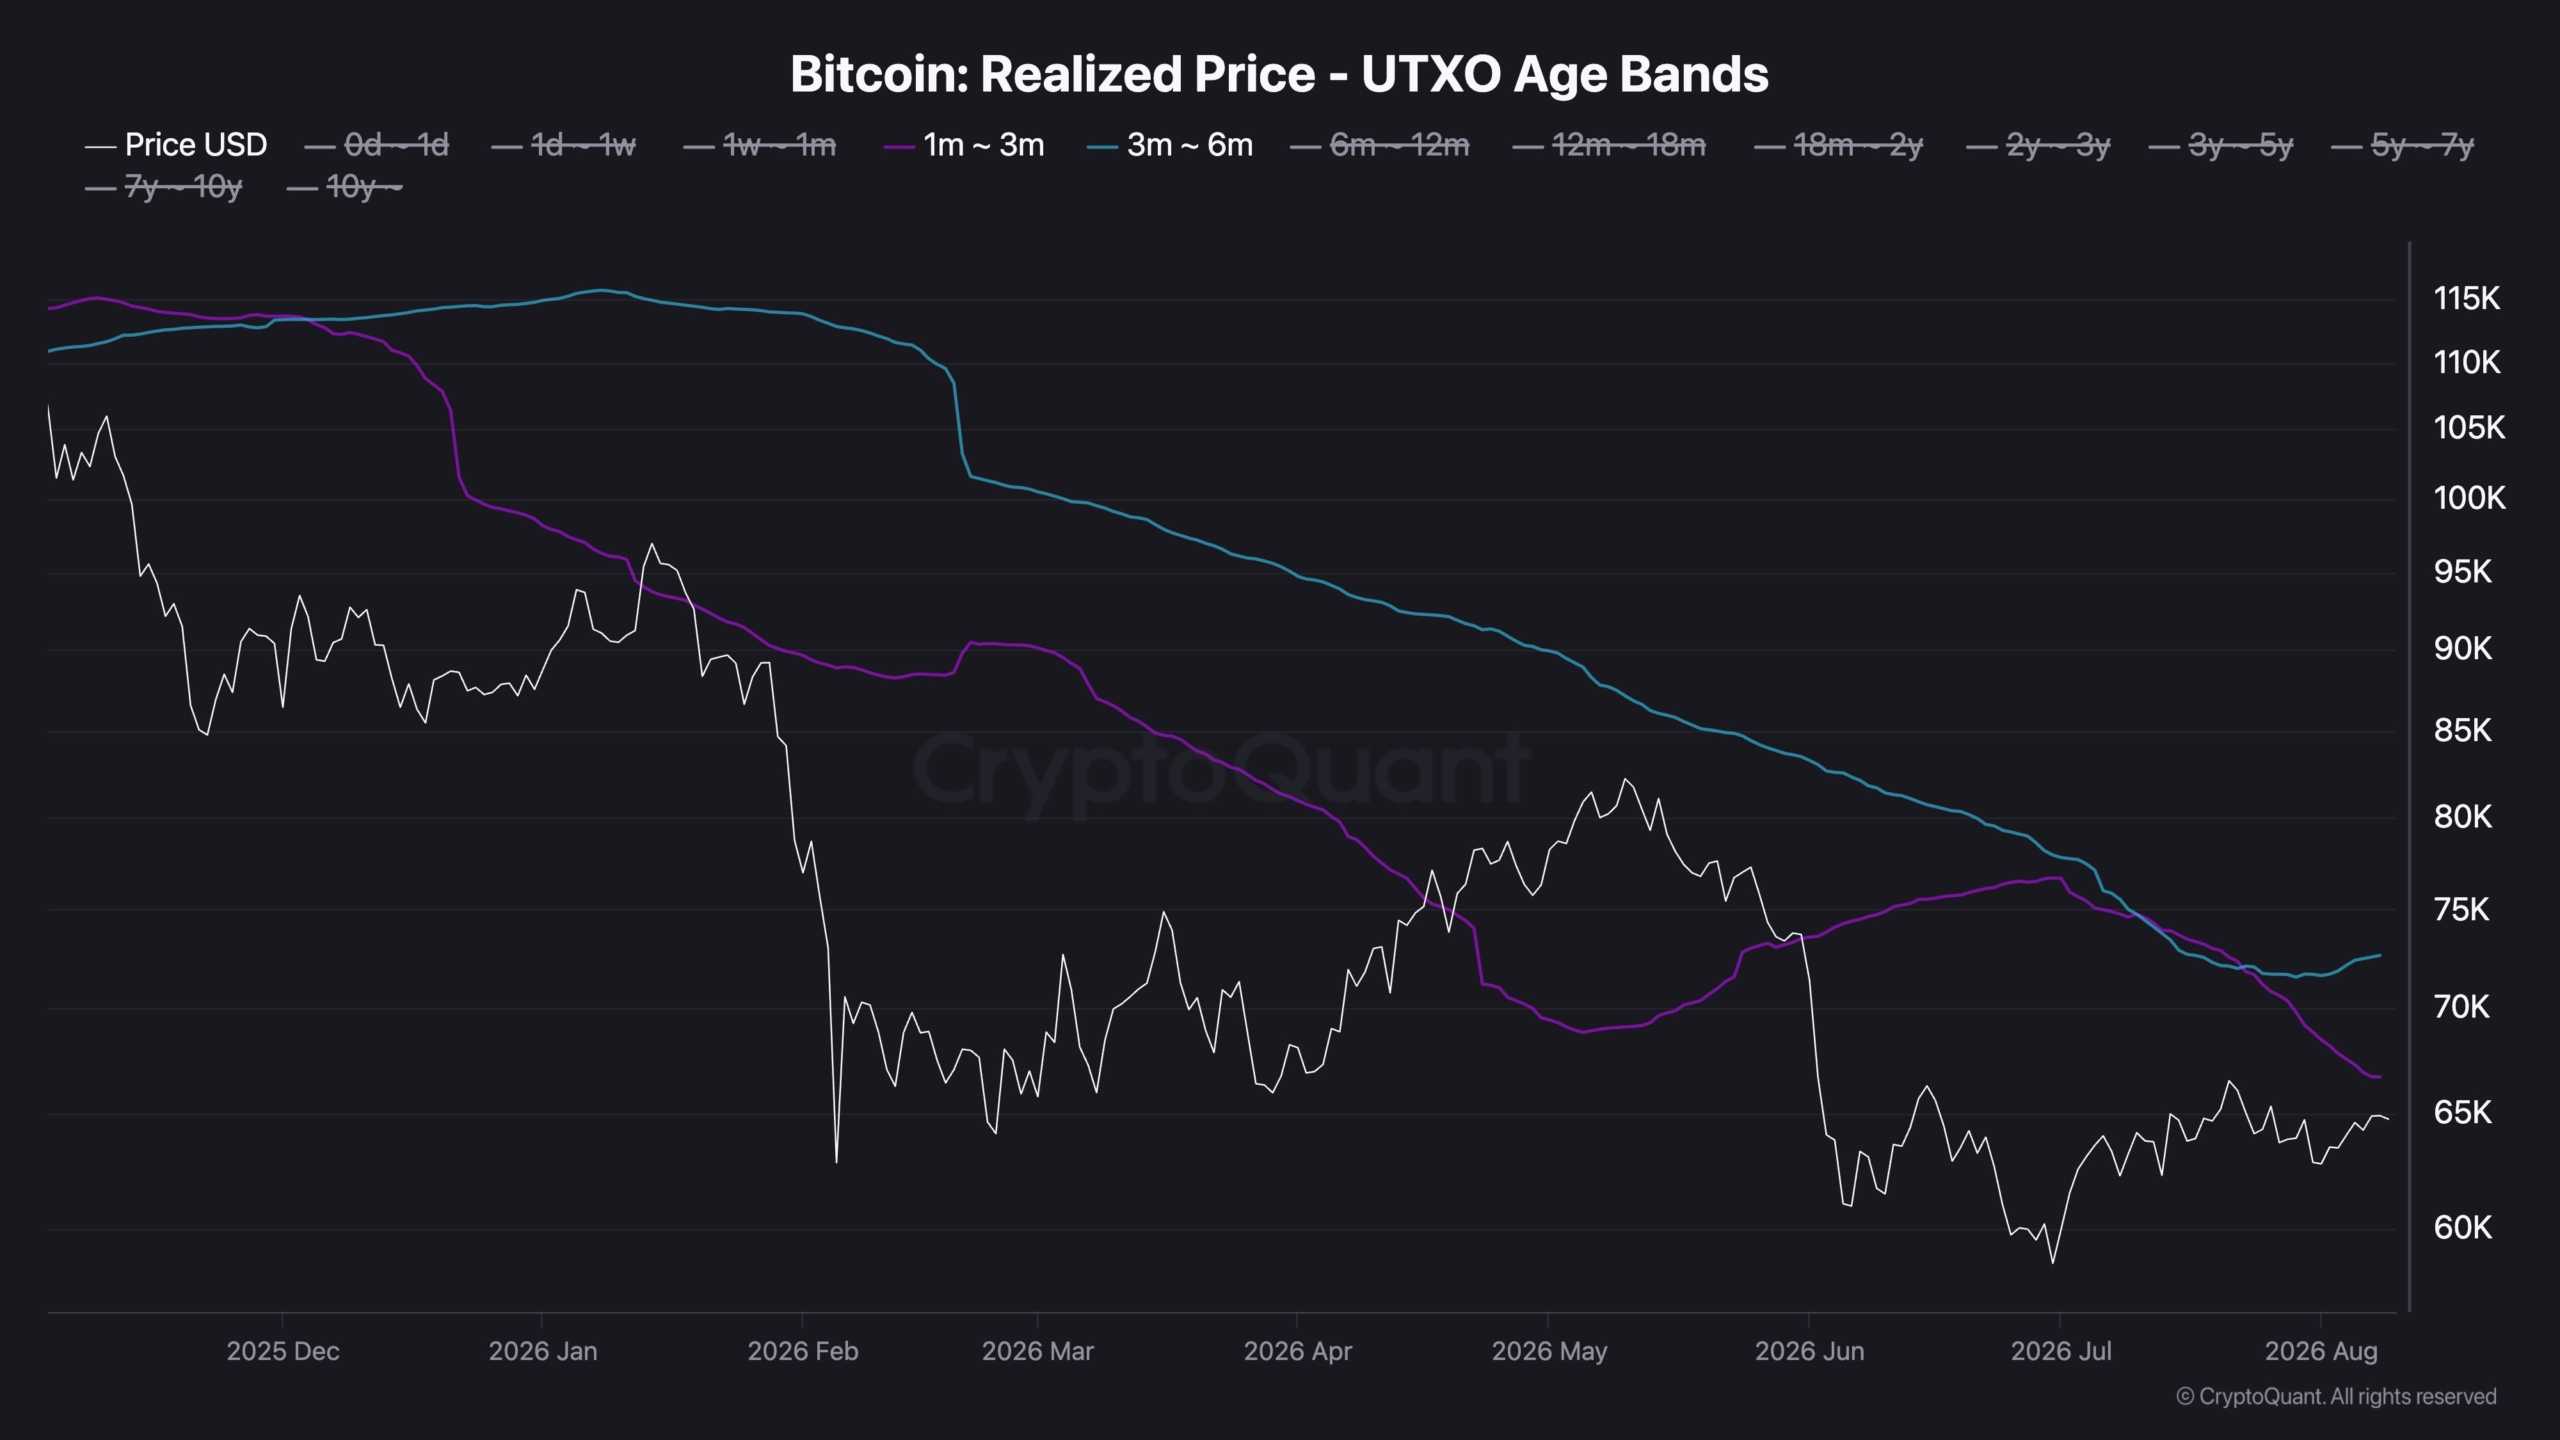
Realized Price UTXO Age Bands add context to current structure. The 1 to 3 month cohort realized price sits near 67000 while the 3 to 6 month group holds around 72000, both above spot. At 65000 both cohorts sit in unrealized loss, forming overhead cost basis that may cap rallies.

The closer 67000 level could act as near term resistance if recent buyers sell into recovery. Reclaiming those bands would show the market absorbing supply and support a stronger rebound narrative. Until then the picture aligns with technical resistance overhead.


Just another echo from the void by iconofsin.eth 💖

Maybe you like what i'm doing here and wanna support me via the ethereum blockchain: iconofsin.eth 💖