Exposing Crypto’s Cutthroat Starts: Just 7% Of Major Tokens Top Their Launch Price 🖤🦇

A sneaky market tracker kept tabs on 113 coins straight from their TGE prices and just 8 sit above water now with a median dip of -95.7% 🖤 the batch only counts projects over 100 million market cap as of July 21.

CryptoRank Peeks At Those Rare Wins 🌑

Eight tokens still in the green topped by HYPE ONDO EVA and NIGHT 🕸 hyperliquid’s HYPE soared 1519 percent from launch when the numbers dropped on July 21 while ONDO finance followed with 101.4 percent evervalue coin EVA gained 20.3 percent and midnight network NIGHT added 16.5 percent 🦇 even among the survivors most gains stayed modest with six of the eight barely double digits and HYPE snuck into that fresh S&P pantera digital asset index which skipped big names like bitcoin.

Reasons Behind The Drops 🌹

Sell offs thin liquidity and regulatory fog drove most of the pain according to cryptorank though exploits and other shocks have wrecked coins hard over the last two years 💀 here is the tweet update on these gloomy stats

The tokens covered everything from defi plays to gaming and fresh infrastructure the broader scene is bouncing with bitcoin pushing past 66000 this week on bigger ETF inflows and softer US inflation vibes 🔮


Just another echo from the void by iconofsin.eth 💖

Maybe you like what i'm doing here and wanna support me via the ethereum blockchain: iconofsin.eth 💖
Bitcoin's Surge Might Be Luring Us Into a Trap With Sub-60K Still in Reach 🖤🕷️

Bitcoin’s Surge Might Be Luring Us Into a Trap With Sub-60K Still in Reach 🖤🕷️

Bitcoin is consolidating just above the 60K region after a volatile first half of 2026 that saw the asset collapse from its January highs near 96K. The recent rebound off the June lows has restored some short-term optimism yet the price is now stalling directly beneath a heavy confluence of moving-average resistance. Whether this becomes the start of a genuine trend reversal or simply another lower high inside the broader downtrend will likely be decided over the next several sessions.

Daily Chart Vibes 🖤

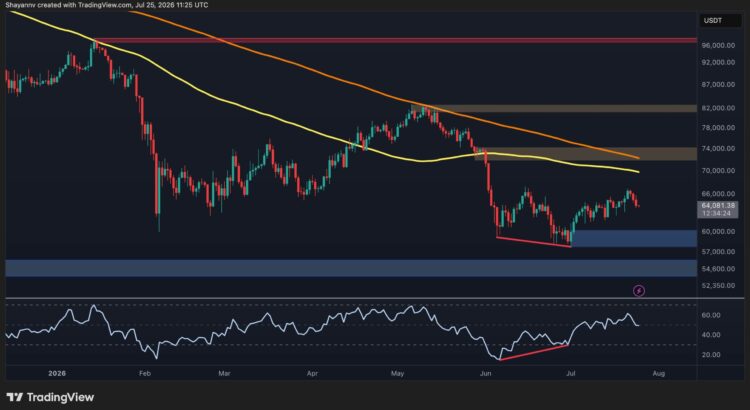
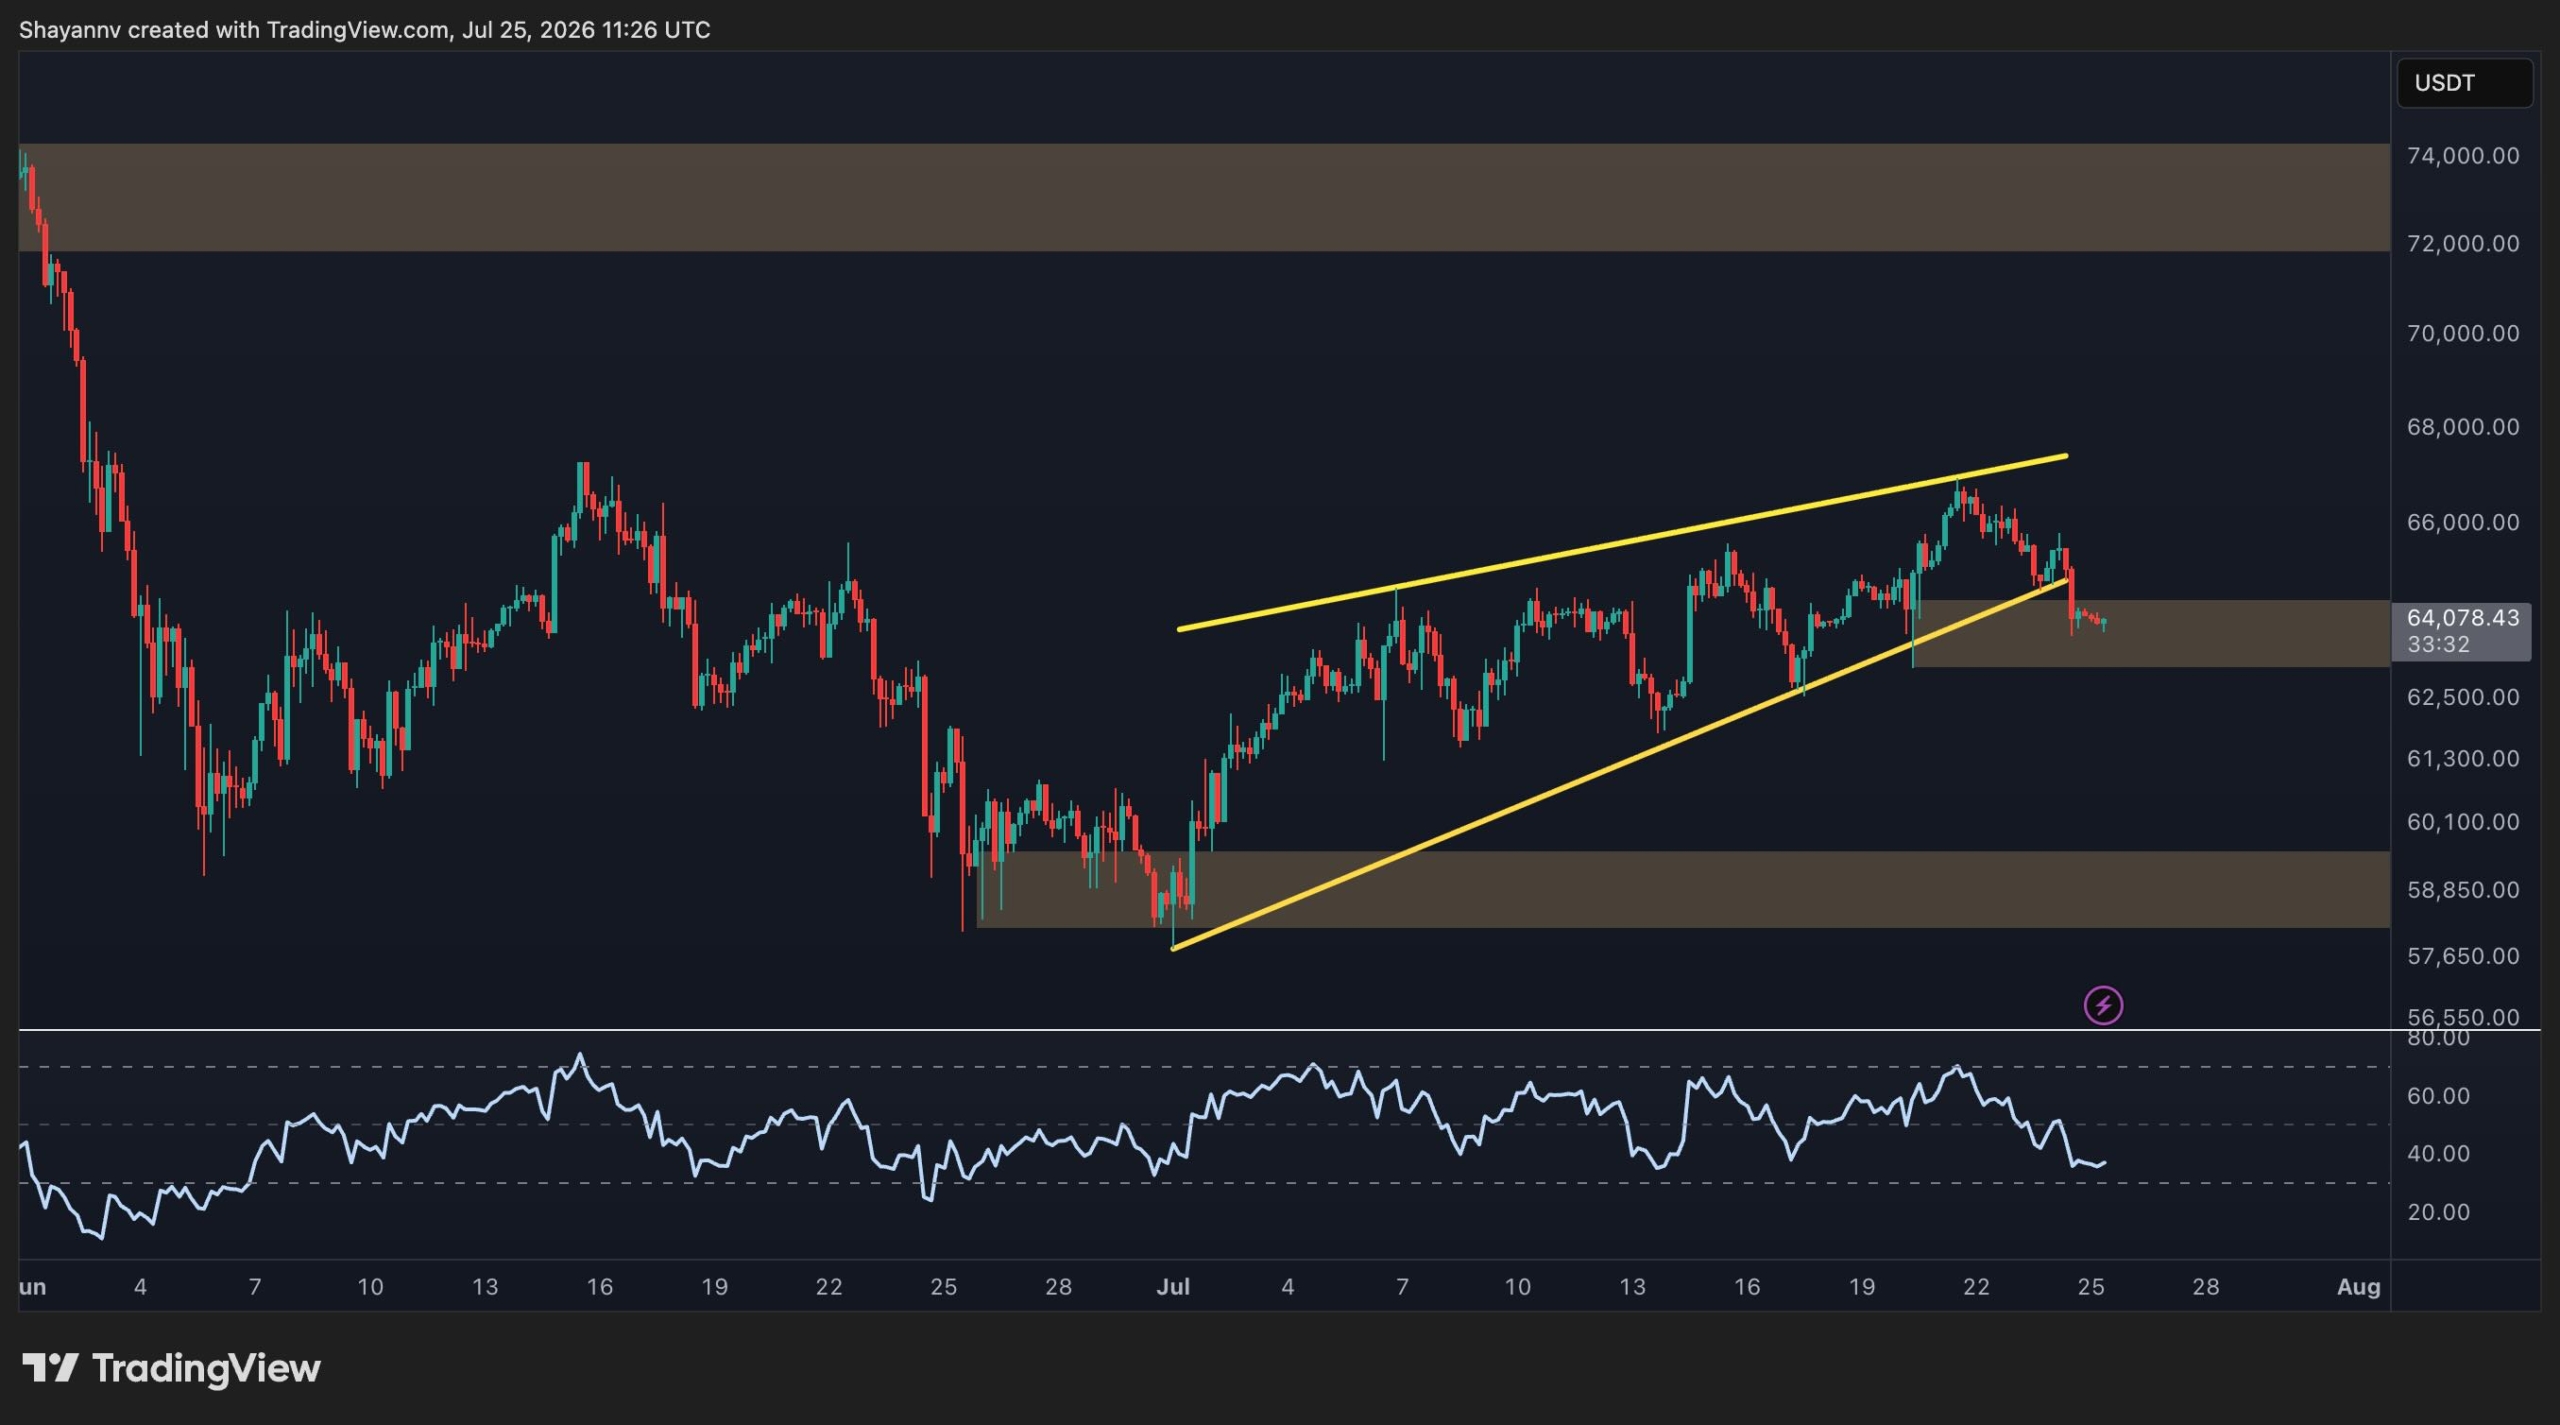
On the daily timeframe BTC remains capped below both its 100-day and 200-day moving averages which are converging near the 70K zone and still slope downward. This signals the higher-timeframe trend has not yet flipped bullish. Since dropping from 96K in January Bitcoin has carved out a sequence of lower highs with the April and May recovery stalling around 82K before rolling over into the June and July low near 58K. However the asset has since printed a series of short-term higher lows relative to the broader structure amid a clear bullish divergence with the RSI and the market has reclaimed the 64K mark. A sustained close above the confluence of moving averages and the 74K supply zone would mark the first real evidence that the downtrend is losing control potentially opening the door toward the prior resistance zone near 82K. On the downside failure to build on this recovery would put the 60K zone back in focus as the immediate support. A breakdown below that level would expose the major demand region around 54K which remains the key higher-timeframe floor.

4-Hour Wedge Games 🌑

The 4-hour chart shows a cleaner picture. Bitcoin bottomed inside the 58K-60K demand zone in late June and has been climbing steadily within a rising wedge pattern printing higher lows along the lower trendline. That advance carried price into the 65K–67K resistance cluster formed by June highs. However the latest candles show a rejection from this area with the price breaking the wedge to the downside and slipping back toward 64K. The RSI has also cooled from overbought territory near 70 down toward the 40 zone reflecting fading momentum rather than outright bearish pressure. A rebound and reclaim of the recent highs around the 67K zone would support a push toward 72K–74K while continued rejection and decline here would validate the rising wedge breakdown and likely send the price back to retest the 58K support area which as things stand is the more probable scenario.

Whale Sentiment Shadows 🕸️

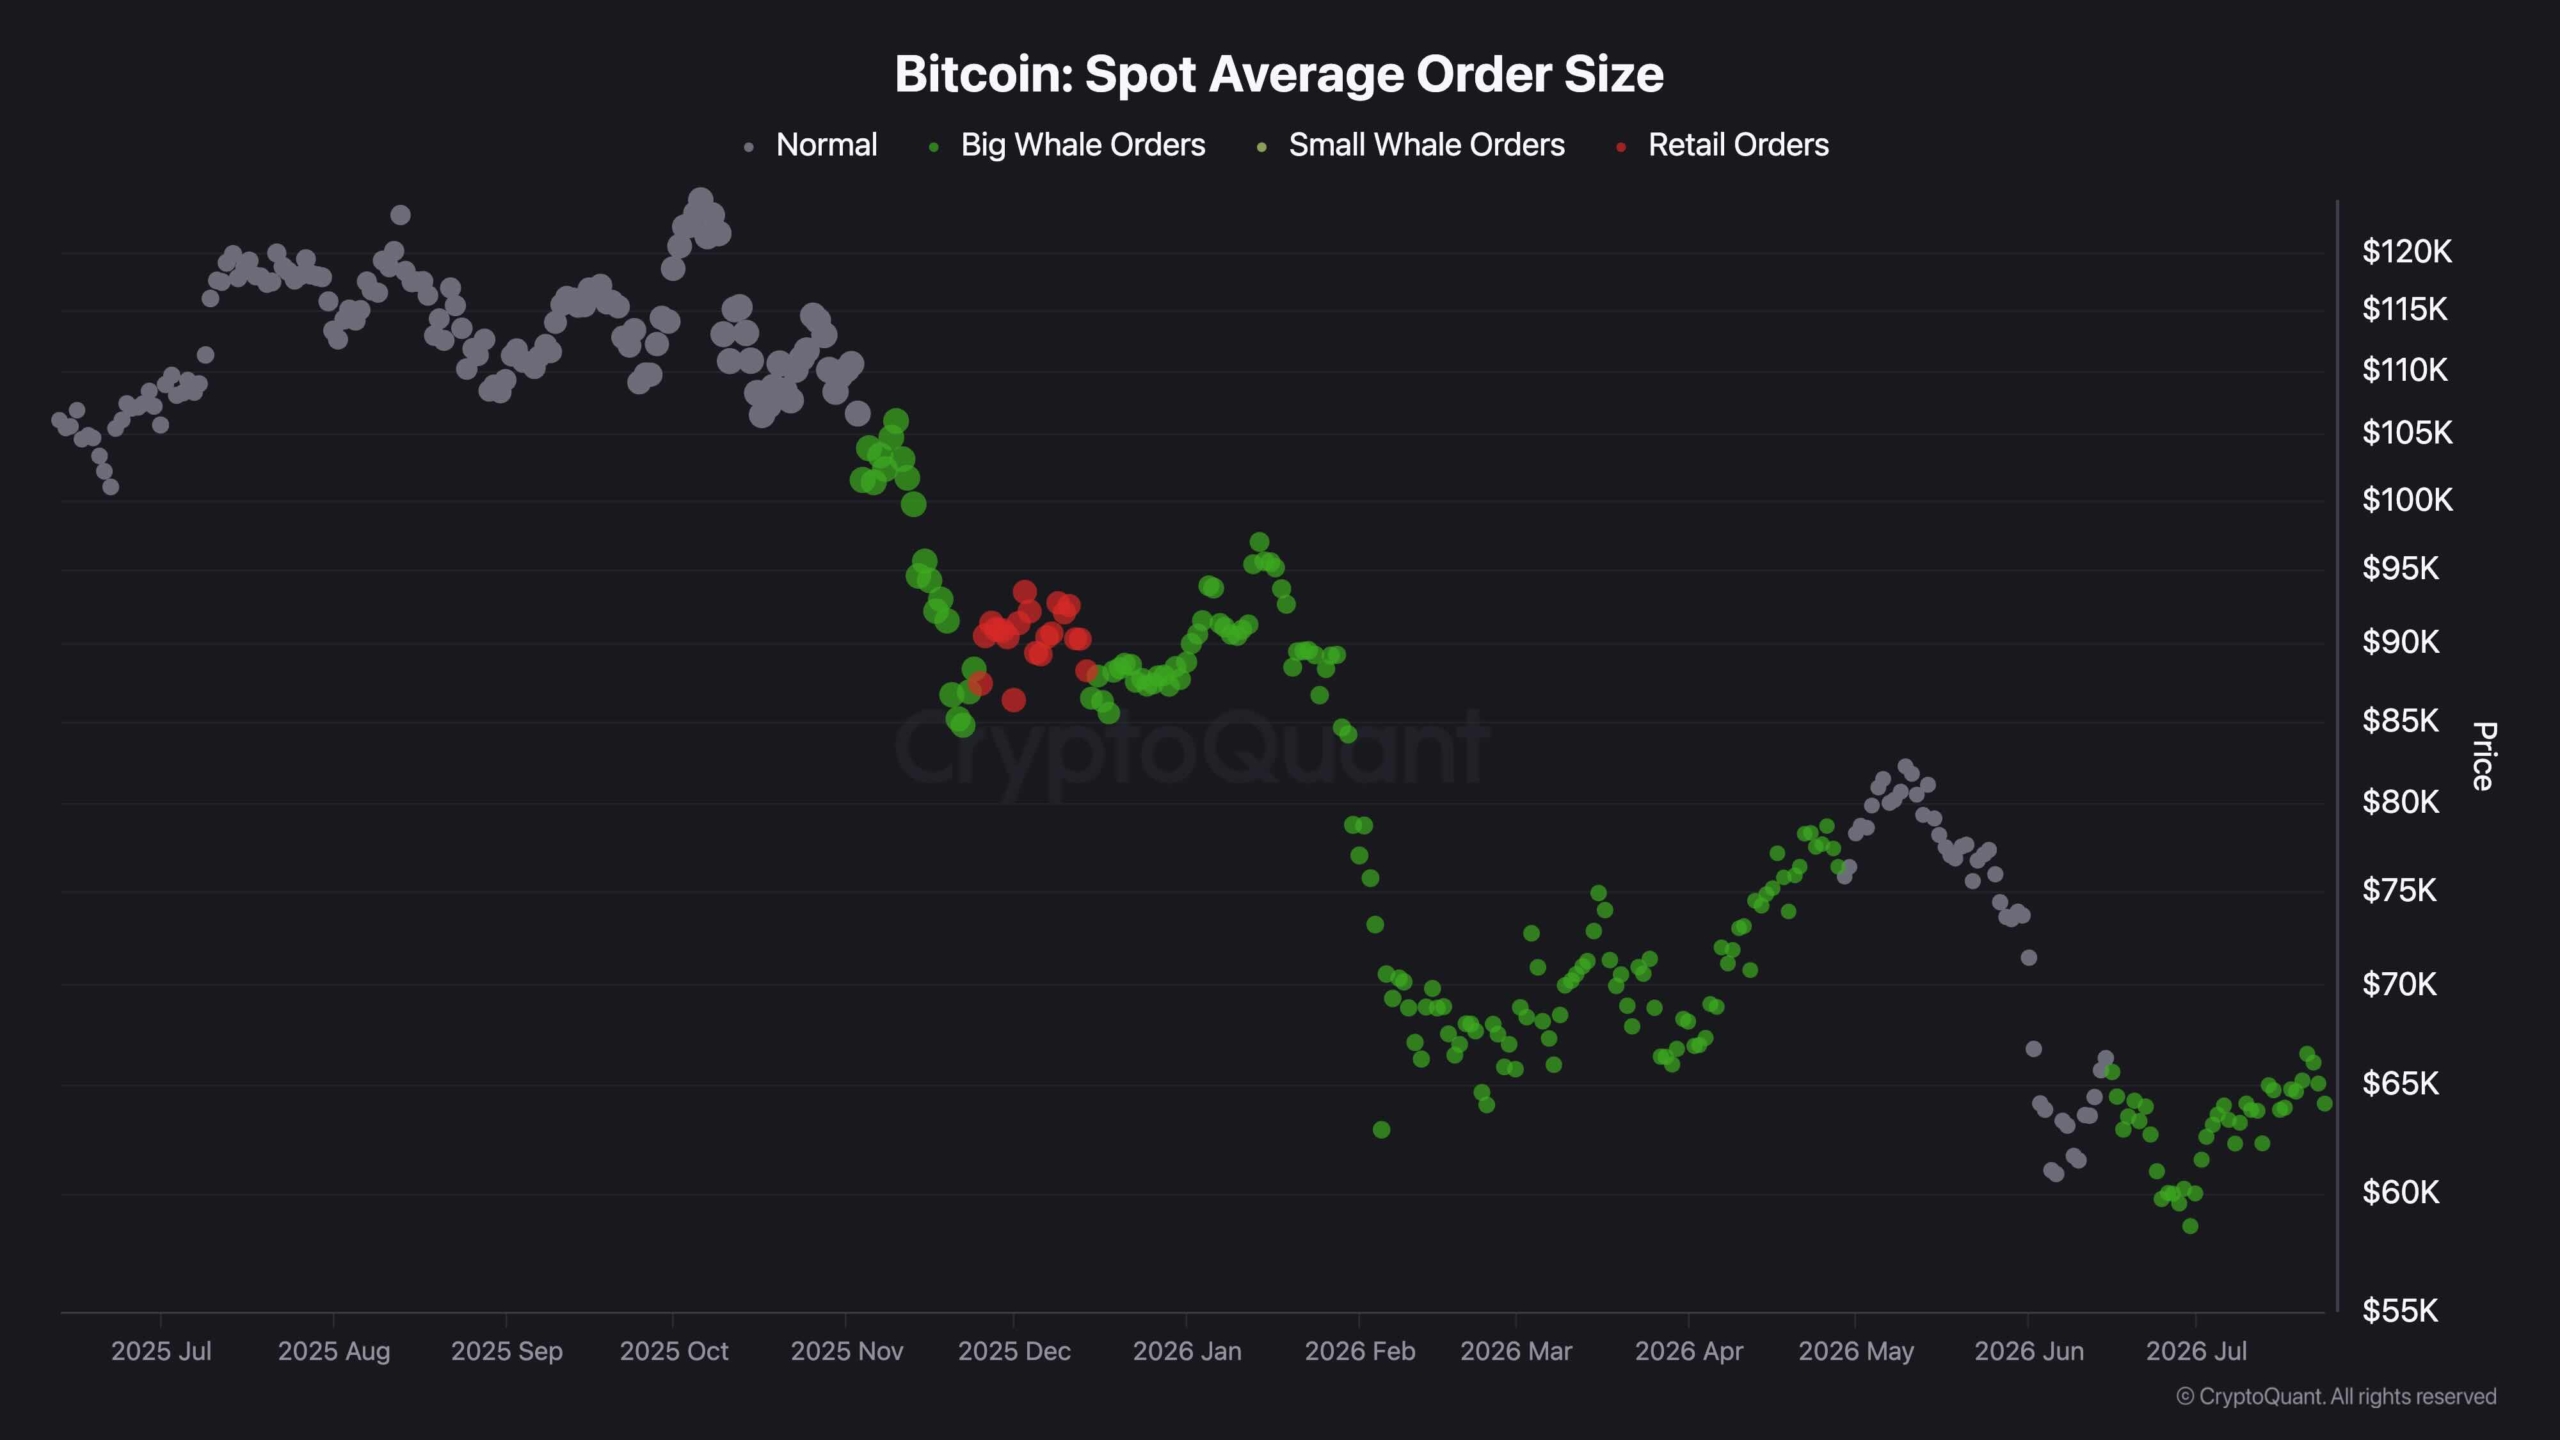
Looking at Bitcoin’s spot average order size large whale orders have dominated the tape through the entire decline and subsequent recovery since June. This marks a shift from the retail-heavy order flow seen back in December 2025 near the 90K region. This metric tracks the size distribution of executed spot orders distinguishing retail-sized trades from large block orders typically associated with institutional or high-net-worth participants. Persistent big-whale activity through a drawdown generally signals accumulation rather than capitulation since larger players tend to scale into weakness rather than chase strength. The continued presence of big whale orders through both the 58K low and the recovery above 64K suggests accumulation has been underway at these depressed levels. If this behavior persists as price approaches the 72K-74K resistance it would lend credibility to the case for a deeper structural reversal. A sudden shift back toward retail-dominated flow near resistance by contrast would serve as a caution flag worth watching and could point to another potential decline in the coming weeks.


Just another echo from the void by iconofsin.eth 💖

Maybe you like what i'm doing here and wanna support me via the ethereum blockchain: iconofsin.eth 💖
ETF Scoop: Ethereum Keeps Surpassing Bitcoin Yet Fissures Begin Showing 🕸️🌙

ETF Scoop: Ethereum Keeps Surpassing Bitcoin Yet Fissures Begin Showing 🕸️🌙

BTC ETFs Still in the Green but… 🖤
The spot Bitcoin exchange-traded funds wrapped their third straight week positive yet the pace slowed sharply toward the close. In the meantime the vehicles tracking Ethereum kept surging with over $100 million flowing in as the underlying asset pushed toward the $1,950 mark.
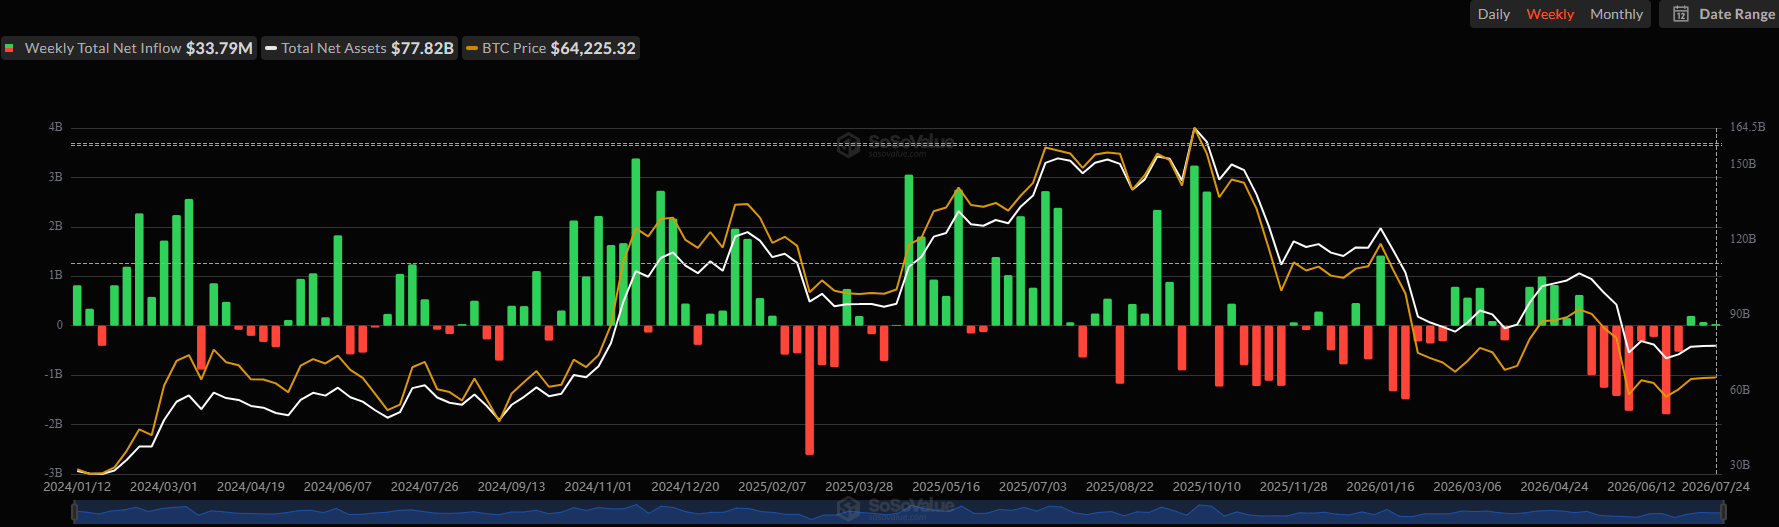
Investors finally flipped their script after eight brutal weeks that drained more than $8 billion from the Bitcoin products and dropped total net inflows from over $59.34 billion down to $51.08 billion by July 2. Nearly $200 million poured back in during the first full week of July followed by another $75.67 million the next and then a powerful $1 billion across seven green sessions from July 14 to July 22. Bitcoin rode that wave straight to $67,000 on Wednesday before rejection sent it sliding to $64,000 by Friday with $225.18 million and $240 million yanked out on Thursday and Friday respectively leaving the week with a modest $33.79 million net.
Spot Bitcoin ETFs Net Flows. Source: SoSoValue
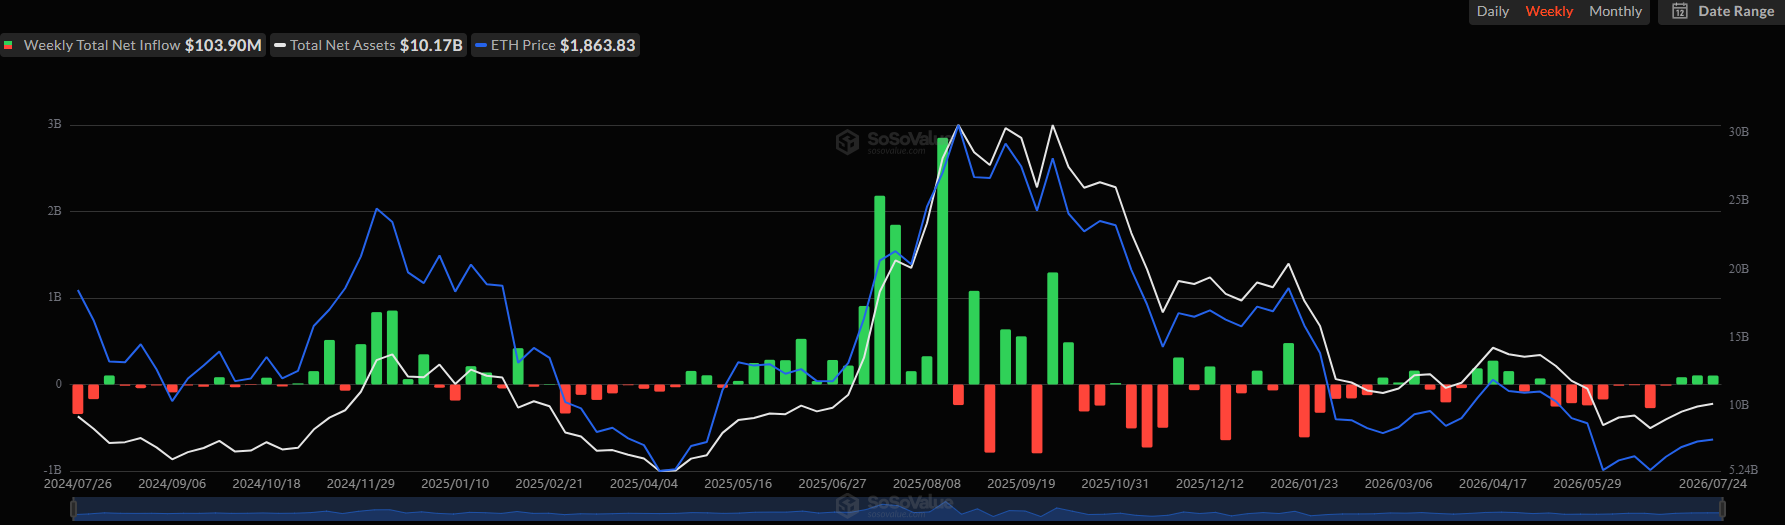
Ethereum products kept stealing the spotlight with almost $104 million in net inflows across the same stretch and just one red day on Friday when $70.62 million left. Earlier the week saw $38.09 million on Monday $37.47 million on Tuesday $72.64 million on Wednesday and $26.32 million on Thursday. That momentum helped push Ether past $1,900 mid-week to a peak above $1,950 before it slipped about $100 by the weekend. Total net inflows for the Ethereum ETFs have clawed back over $200 million in the past three weeks yet they remain far below the $12.09 billion mark from May.
Spot Ethereum ETF Flows. Source: SoSoValue
Ethereum Still Outpaces Bitcoin but Cracks Are Emerging 🕸️


Just another echo from the void by iconofsin.eth 💖

Maybe you like what i'm doing here and wanna support me via the ethereum blockchain: iconofsin.eth 💖
Wld Dives Ten Percent Despite The Fifty Two Point Five Funding Round While Btc Struggles At Sixty Four K: Weekend Watch 🖤🌒

Wld Dives Ten Percent Despite The Fifty Two Point Five Funding Round While Btc Struggles At Sixty Four K: Weekend Watch 🖤🌒

After gaining several grand and peaking at $67000 earlier this week bitcoin faced an immediate rejection and dipped below $64000 where it currently struggles. Most larger cap alts are also in the red on a daily scale now with eth slipping to $1850 xrp fighting for the $1.10 support and zec dropping by 6 percent.

BTC Faces Friday Rejection 🖤

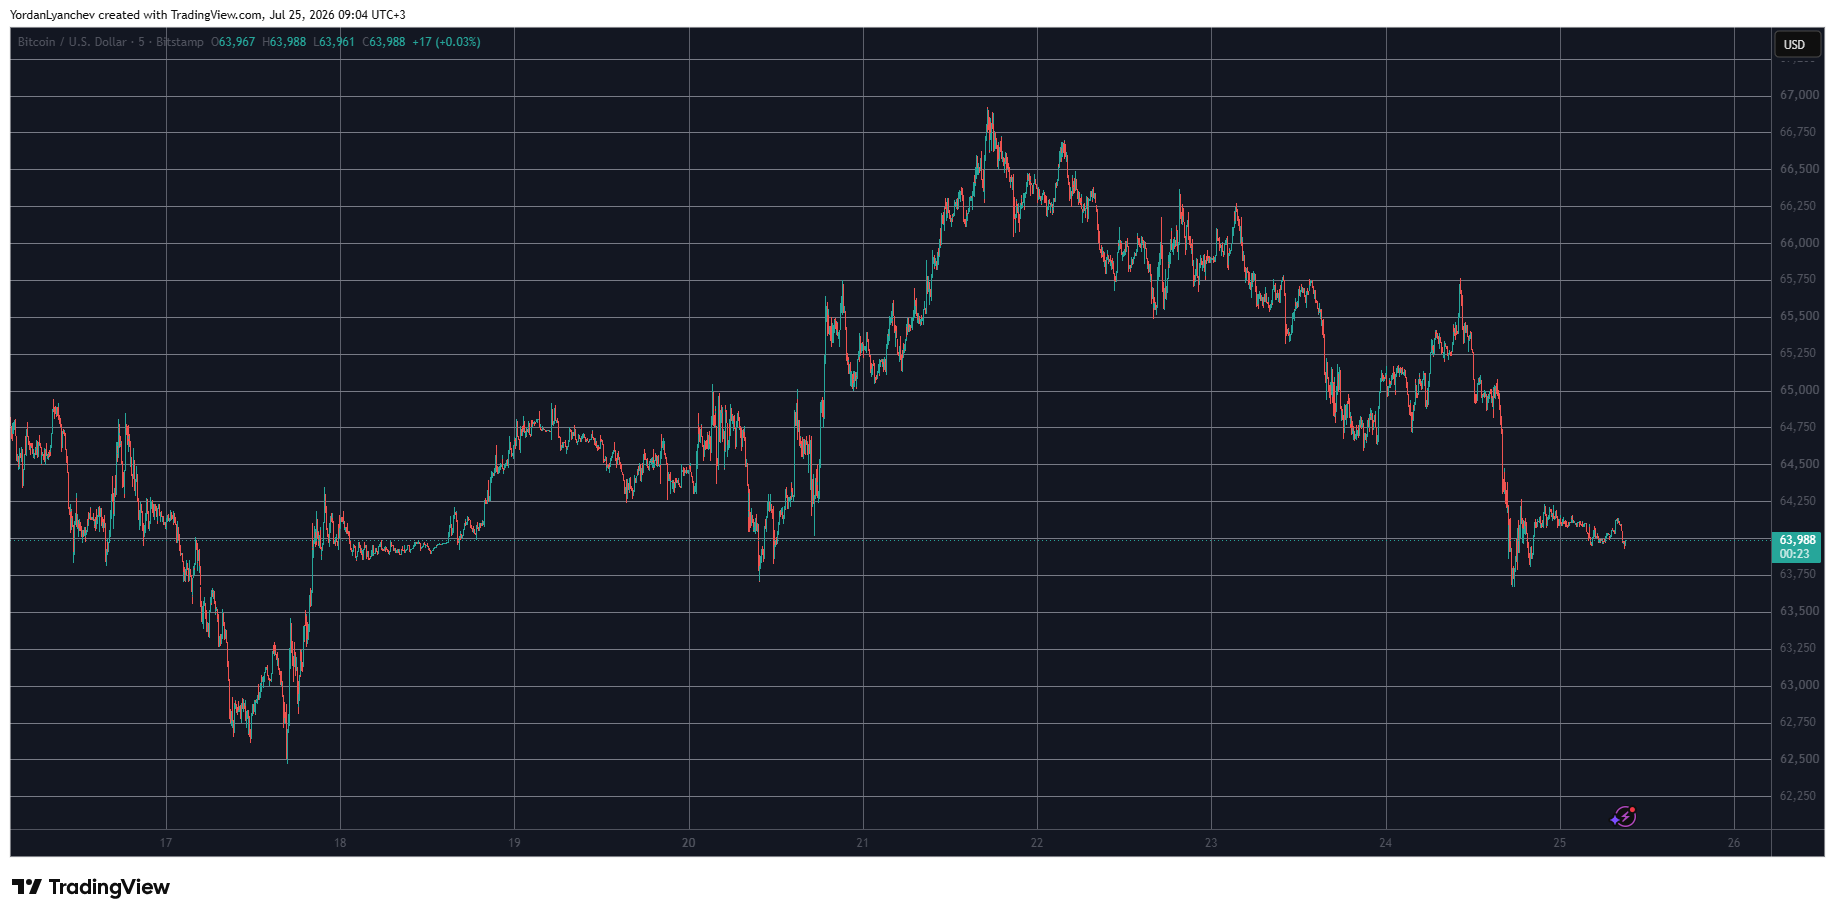
On the surface the past week appeared quite positive for the primary cryptocurrency given the overall market sentiment. After dipping to $63750 on Monday the asset went on a highly successful run and soared to $67000 on Tuesday evening for the first time in over a month. Some of the reasons behind this jump included renewed etf net inflows and new purchases from whales.

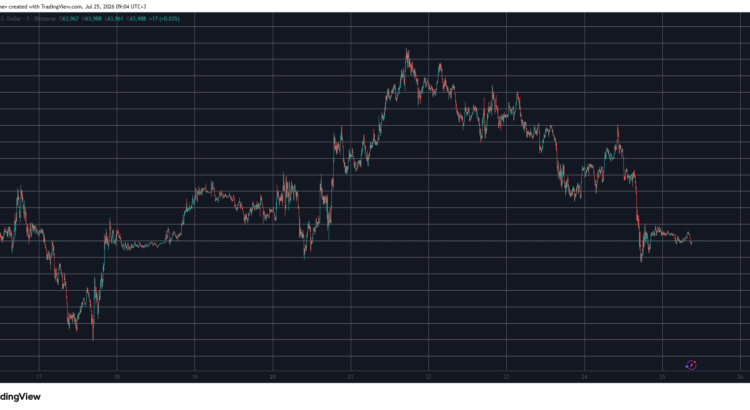
However the fragile market state failed to provide more rally support and btc went downhill in the following days. It dropped to $64750 on Thursday before it jumped by a grand on Friday morning. However another rejection followed which is rather typical for Fridays in the past several weeks and btc dipped by $2000 after us president trump warned the eu about a new set of tariffs. Bitcoin has been unable to stage a notable recovery since then and remains struggling at around $64000 as of press time. Its market capitalization has dipped to $1.285 trillion while its dominance over the altcoins has rebounded slightly to 56.3 percent.

BTCUSD July 25. Source: TradingView

WLD Crashes Despite Fresh Funding 🌑

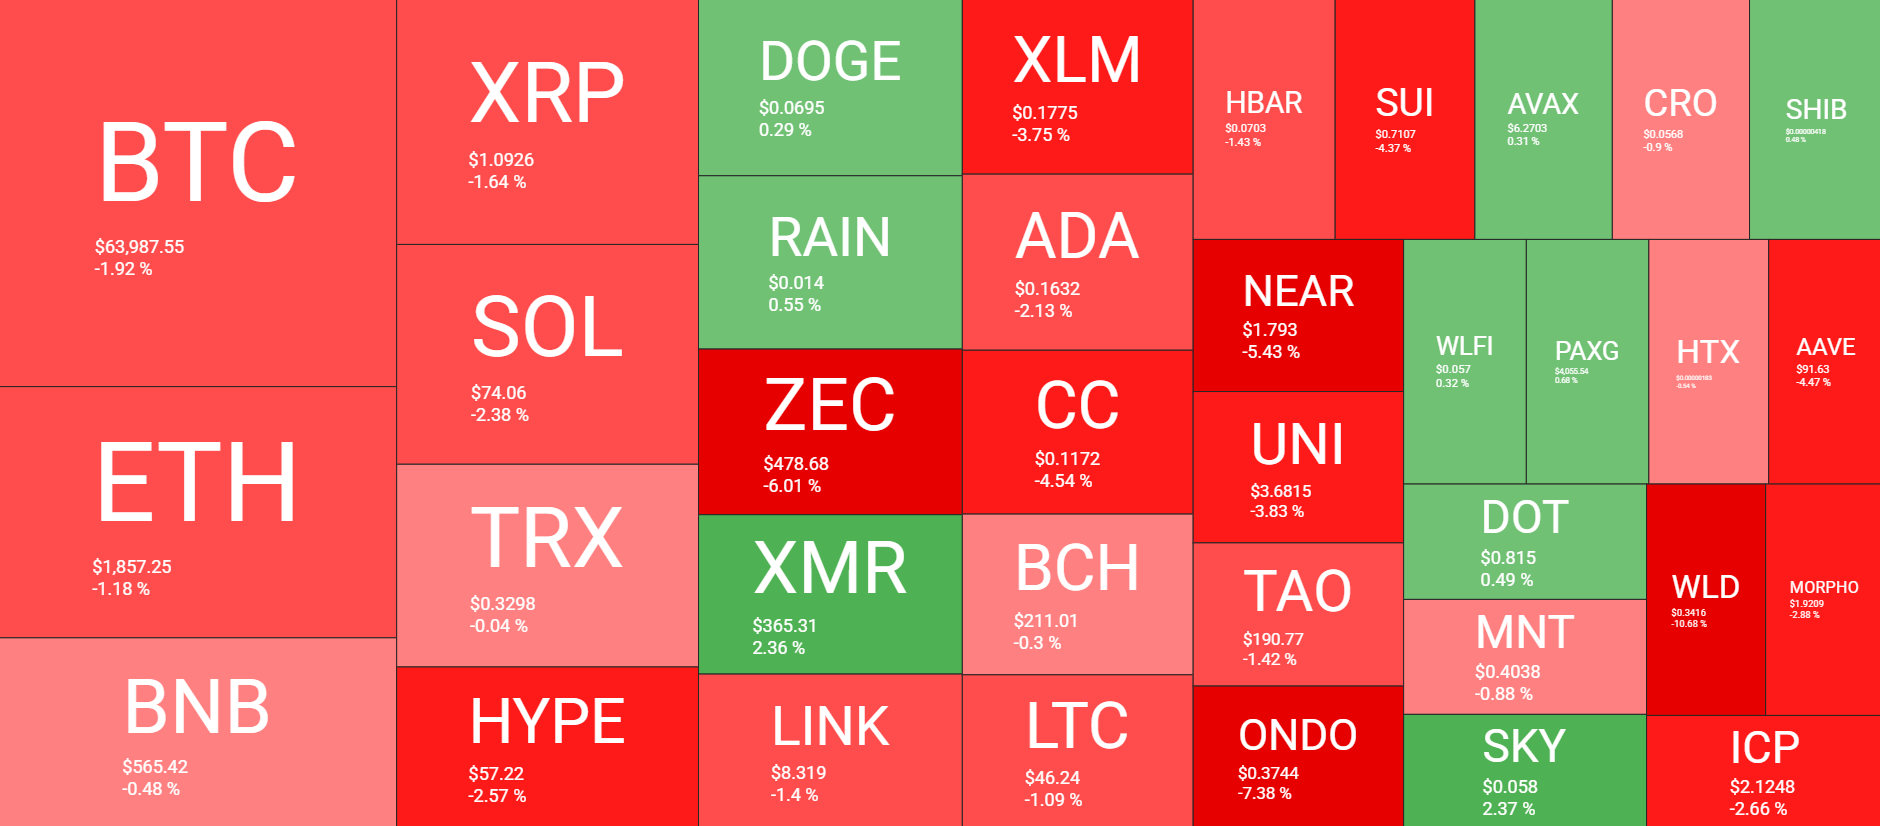
Worldcoin’s native token is the poorest performer today plunging by over 10 percent to $0.34. Interestingly this major decline comes after the project announced a successful fundraiser for $52.5 million to expand its world id infrastructure. The other big losers today are ondo at negative 7 percent lit at negative 6.3 percent and zec at negative 6 percent. The privacy coin has dropped further away from the $500 mark.

The larger cap alts are also in the red albeit in a 1 to 2 percent manner. Eth is below $1860 xrp is beneath $1.10 sol is down to $74 while hype has slipped to $57. Xmr continues to be among the few altcoins charting some gains. A 2.4 percent jump has pushed it to $365. The total crypto market cap has lost around $20 billion daily and is down to $2.280 trillion on cg.

Cryptocurrency Market Overview July 25. Source: QuantifyCrypto


Just another echo from the void by iconofsin.eth 💖

Maybe you like what i'm doing here and wanna support me via the ethereum blockchain: iconofsin.eth 💖