XRP Tempts a Pivotal Trendline After Its Dip 🖤🌙

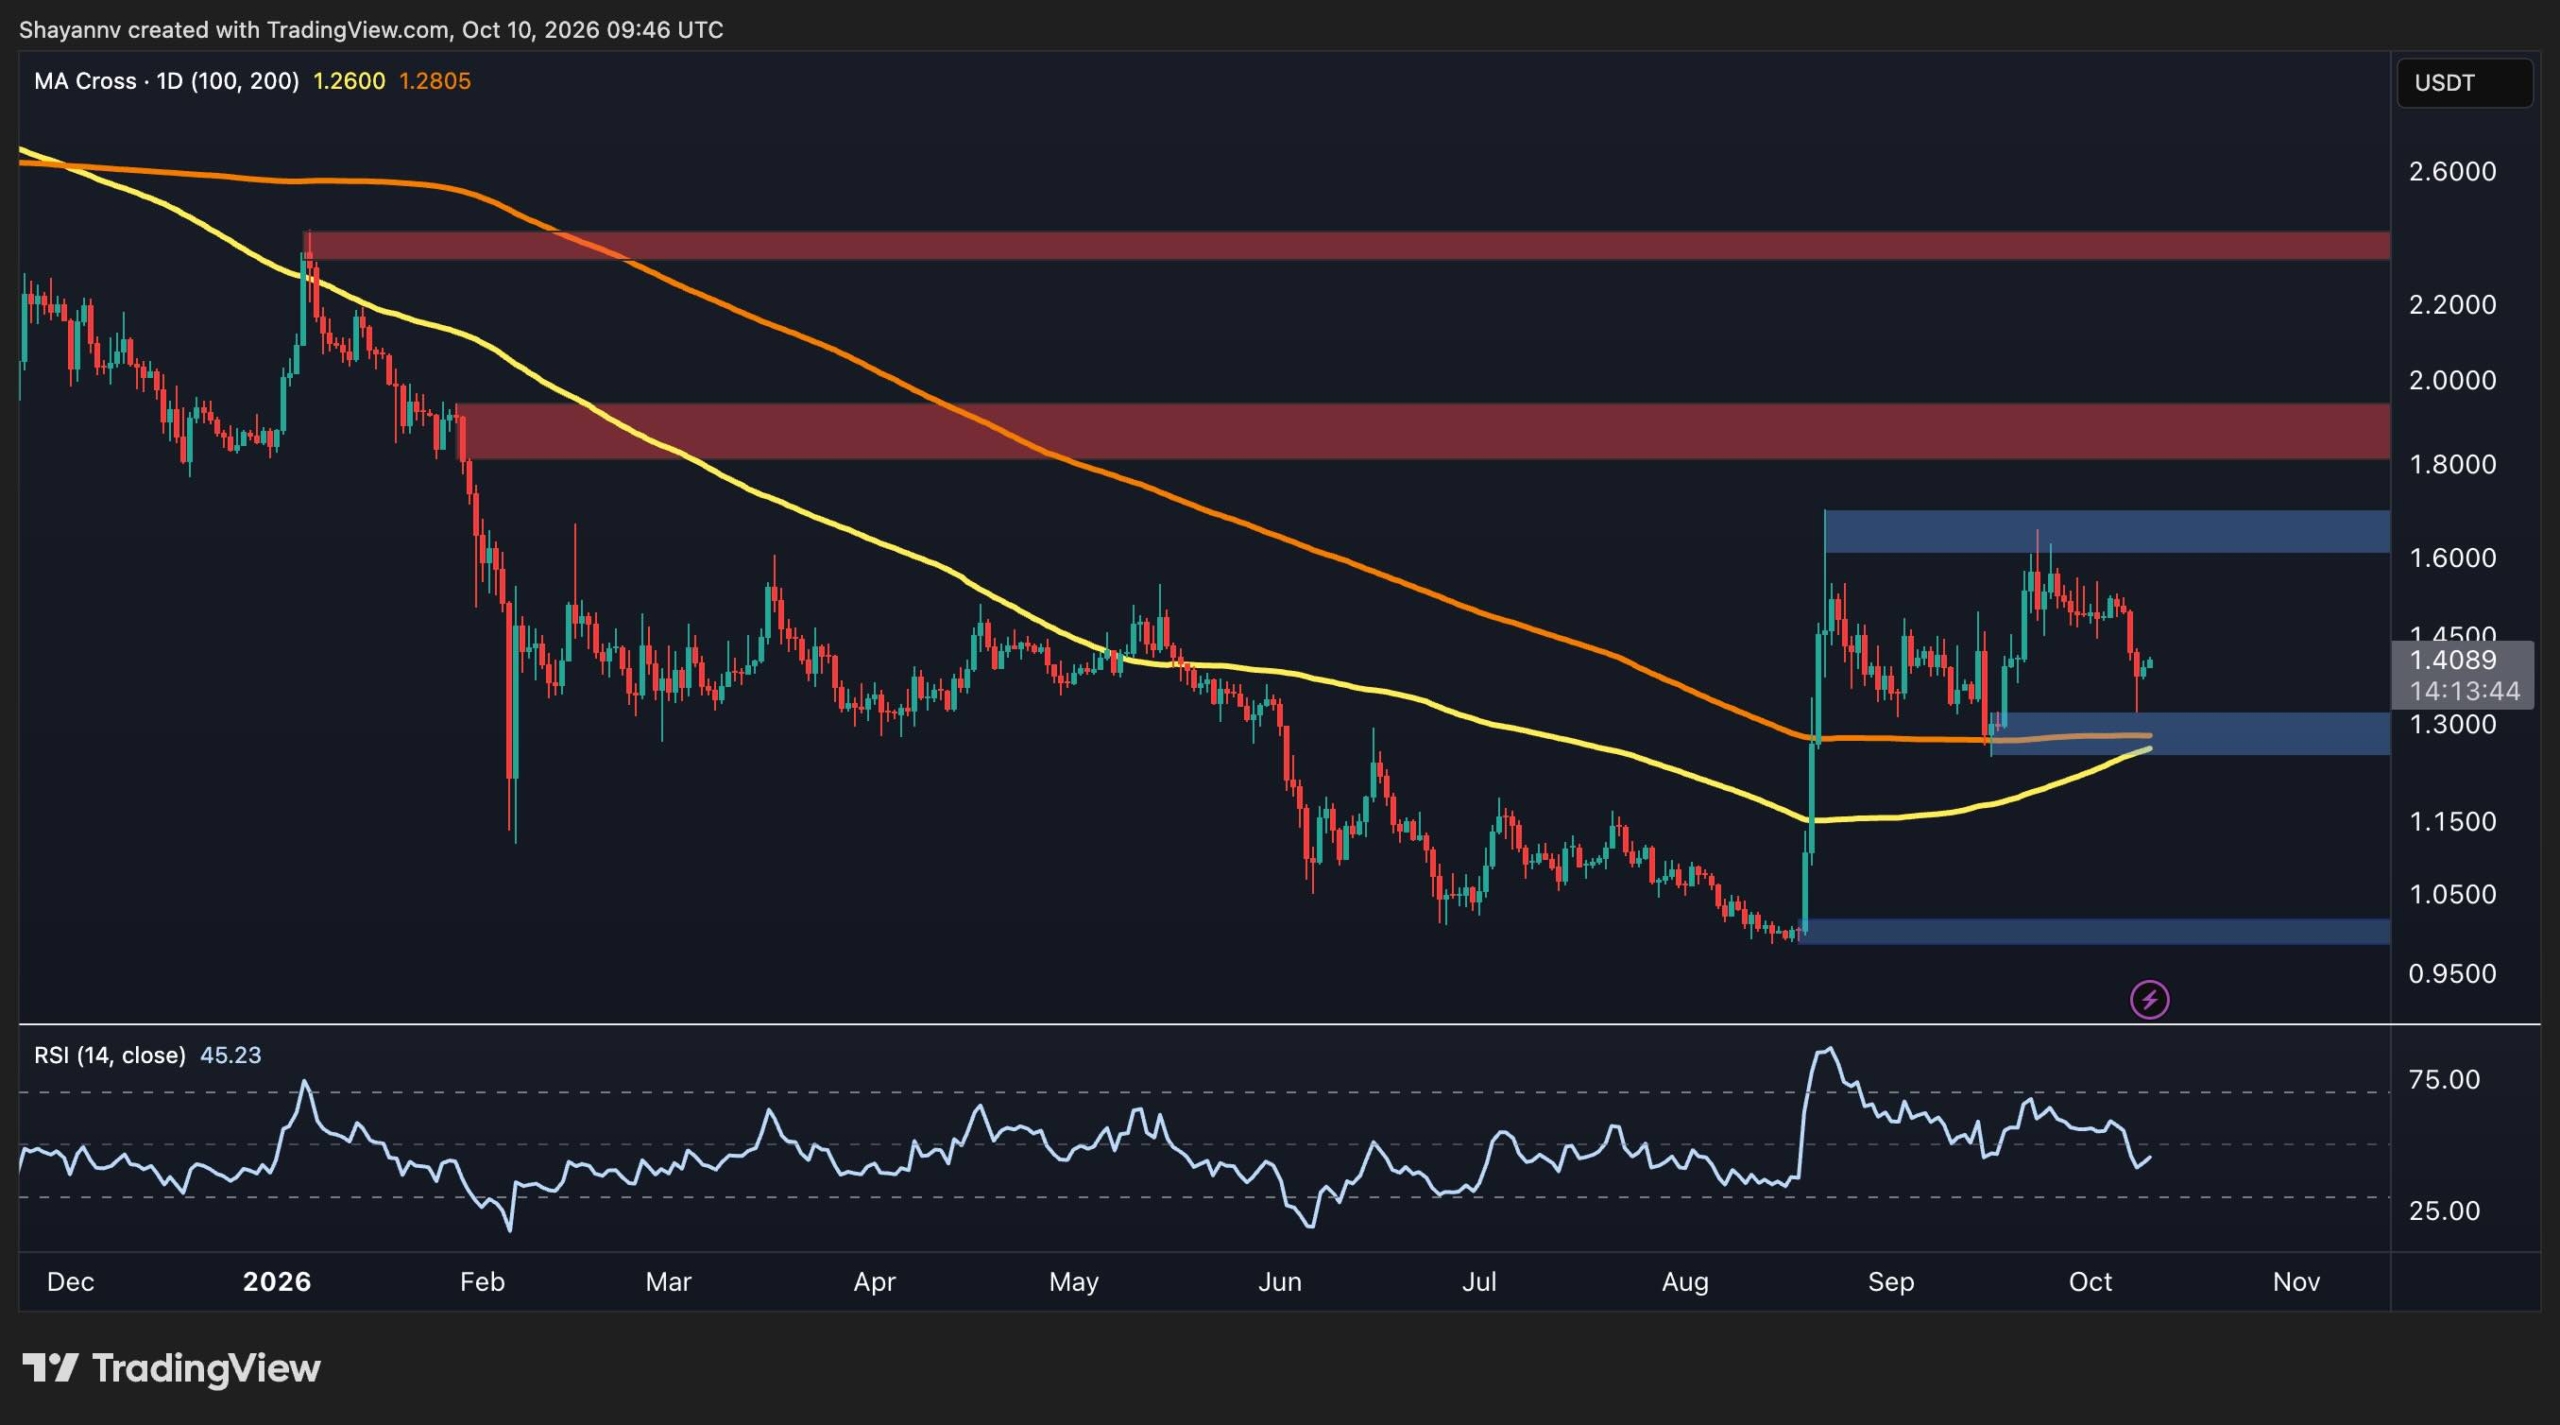
XRP is trying to chill after that wild drop from its September highs rn, sitting at around $1.40. Buyers pulled off a little rebound from the $1.30 support zone but the bigger picture still looks kinda mixed overall. It gotta snag some nearby resistance to keep this recovery going or else another rejection might yank it down to lower levels fr.

Ripple Price Vibes On The USDT Side 💀

XRP’s daily vibes show a solid recovery from those August lows below $1 followed by a sharp pump that pushed it up near the $1.60 zone. Yet the market shut that down twice already which means bullish energy has faded a bunch. Right now it’s hovering around $1.40 while the $1.30 area acts like key support that already caught some buying interest during the recent bounce. Holding there might let it consolidate for another push higher tho a clean breakdown would mess up the recovery and drag focus back to the $1 zone. The 100-day and 200-day moving averages are also getting close for a potential bullish crossover near $1.30 which makes this spot super important for XRP’s short to mid term direction. Still the RSI dipping below neutral 50 shows weak momentum so the market faces real risk of losing that key support.
Zooming Into The 4-Hour Scene 🌙

The 4-hour view makes that recent correction pop more clearly. XRP has been stuck under a descending resistance trendline from the September highs with lower highs showing selling pressure still around. The latest dip hit near the $1.30 support before buyers jumped in for a modest rebound toward $1.40. Even with that bounce it stays below the $1.45 resistance spot which lines up with the trendline making it crucial for whether this rebound turns into something bigger. A real breakout above $1.45 could kill the short term bearish setup and open a path back toward $1.60. On the flip side a rejection there might send it back toward the $1.15 imbalance from the big August rally. The 4-hour RSI has climbed above oversold to around 40 so selling has eased a bit but it stays under 50 without confirming any bullish shift yet. Overall XRP sits at a key turning point where defending $1.30 gives bulls a shot to extend the rebound but that descending trendline plus resistance near $1.45 block the way. Breaking above would boost the recovery case while losing $1.30 again raises chances of a deeper correction 🖤✨🕸️💎🦇👀🌑🚀


Just another echo from the void by iconofsin.eth 💖


Maybe you like what i'm doing here and wanna support me via the ethereum blockchain: iconofsin.eth 💖

Bitcoin’s Comeback Vibes: Is The Rebound Fizzling As US Demand Goes Icy? 🦇💕

Bitcoin’s chilling at 83K rn after that rejection from the 86K to 90K resistance zone messed with the short-term setup 😈 while the Coinbase Premium Index went all negative, hinting US buying interest is fading a bit. BTC’s fighting to stabilize tho but buyers gotta snag back some resistance zones to brighten the outlook 💀

Bitcoin’s Daily Chart Glow Up 🖤

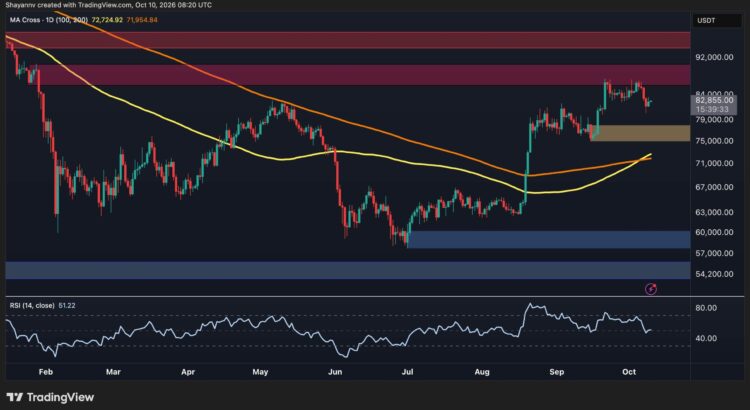
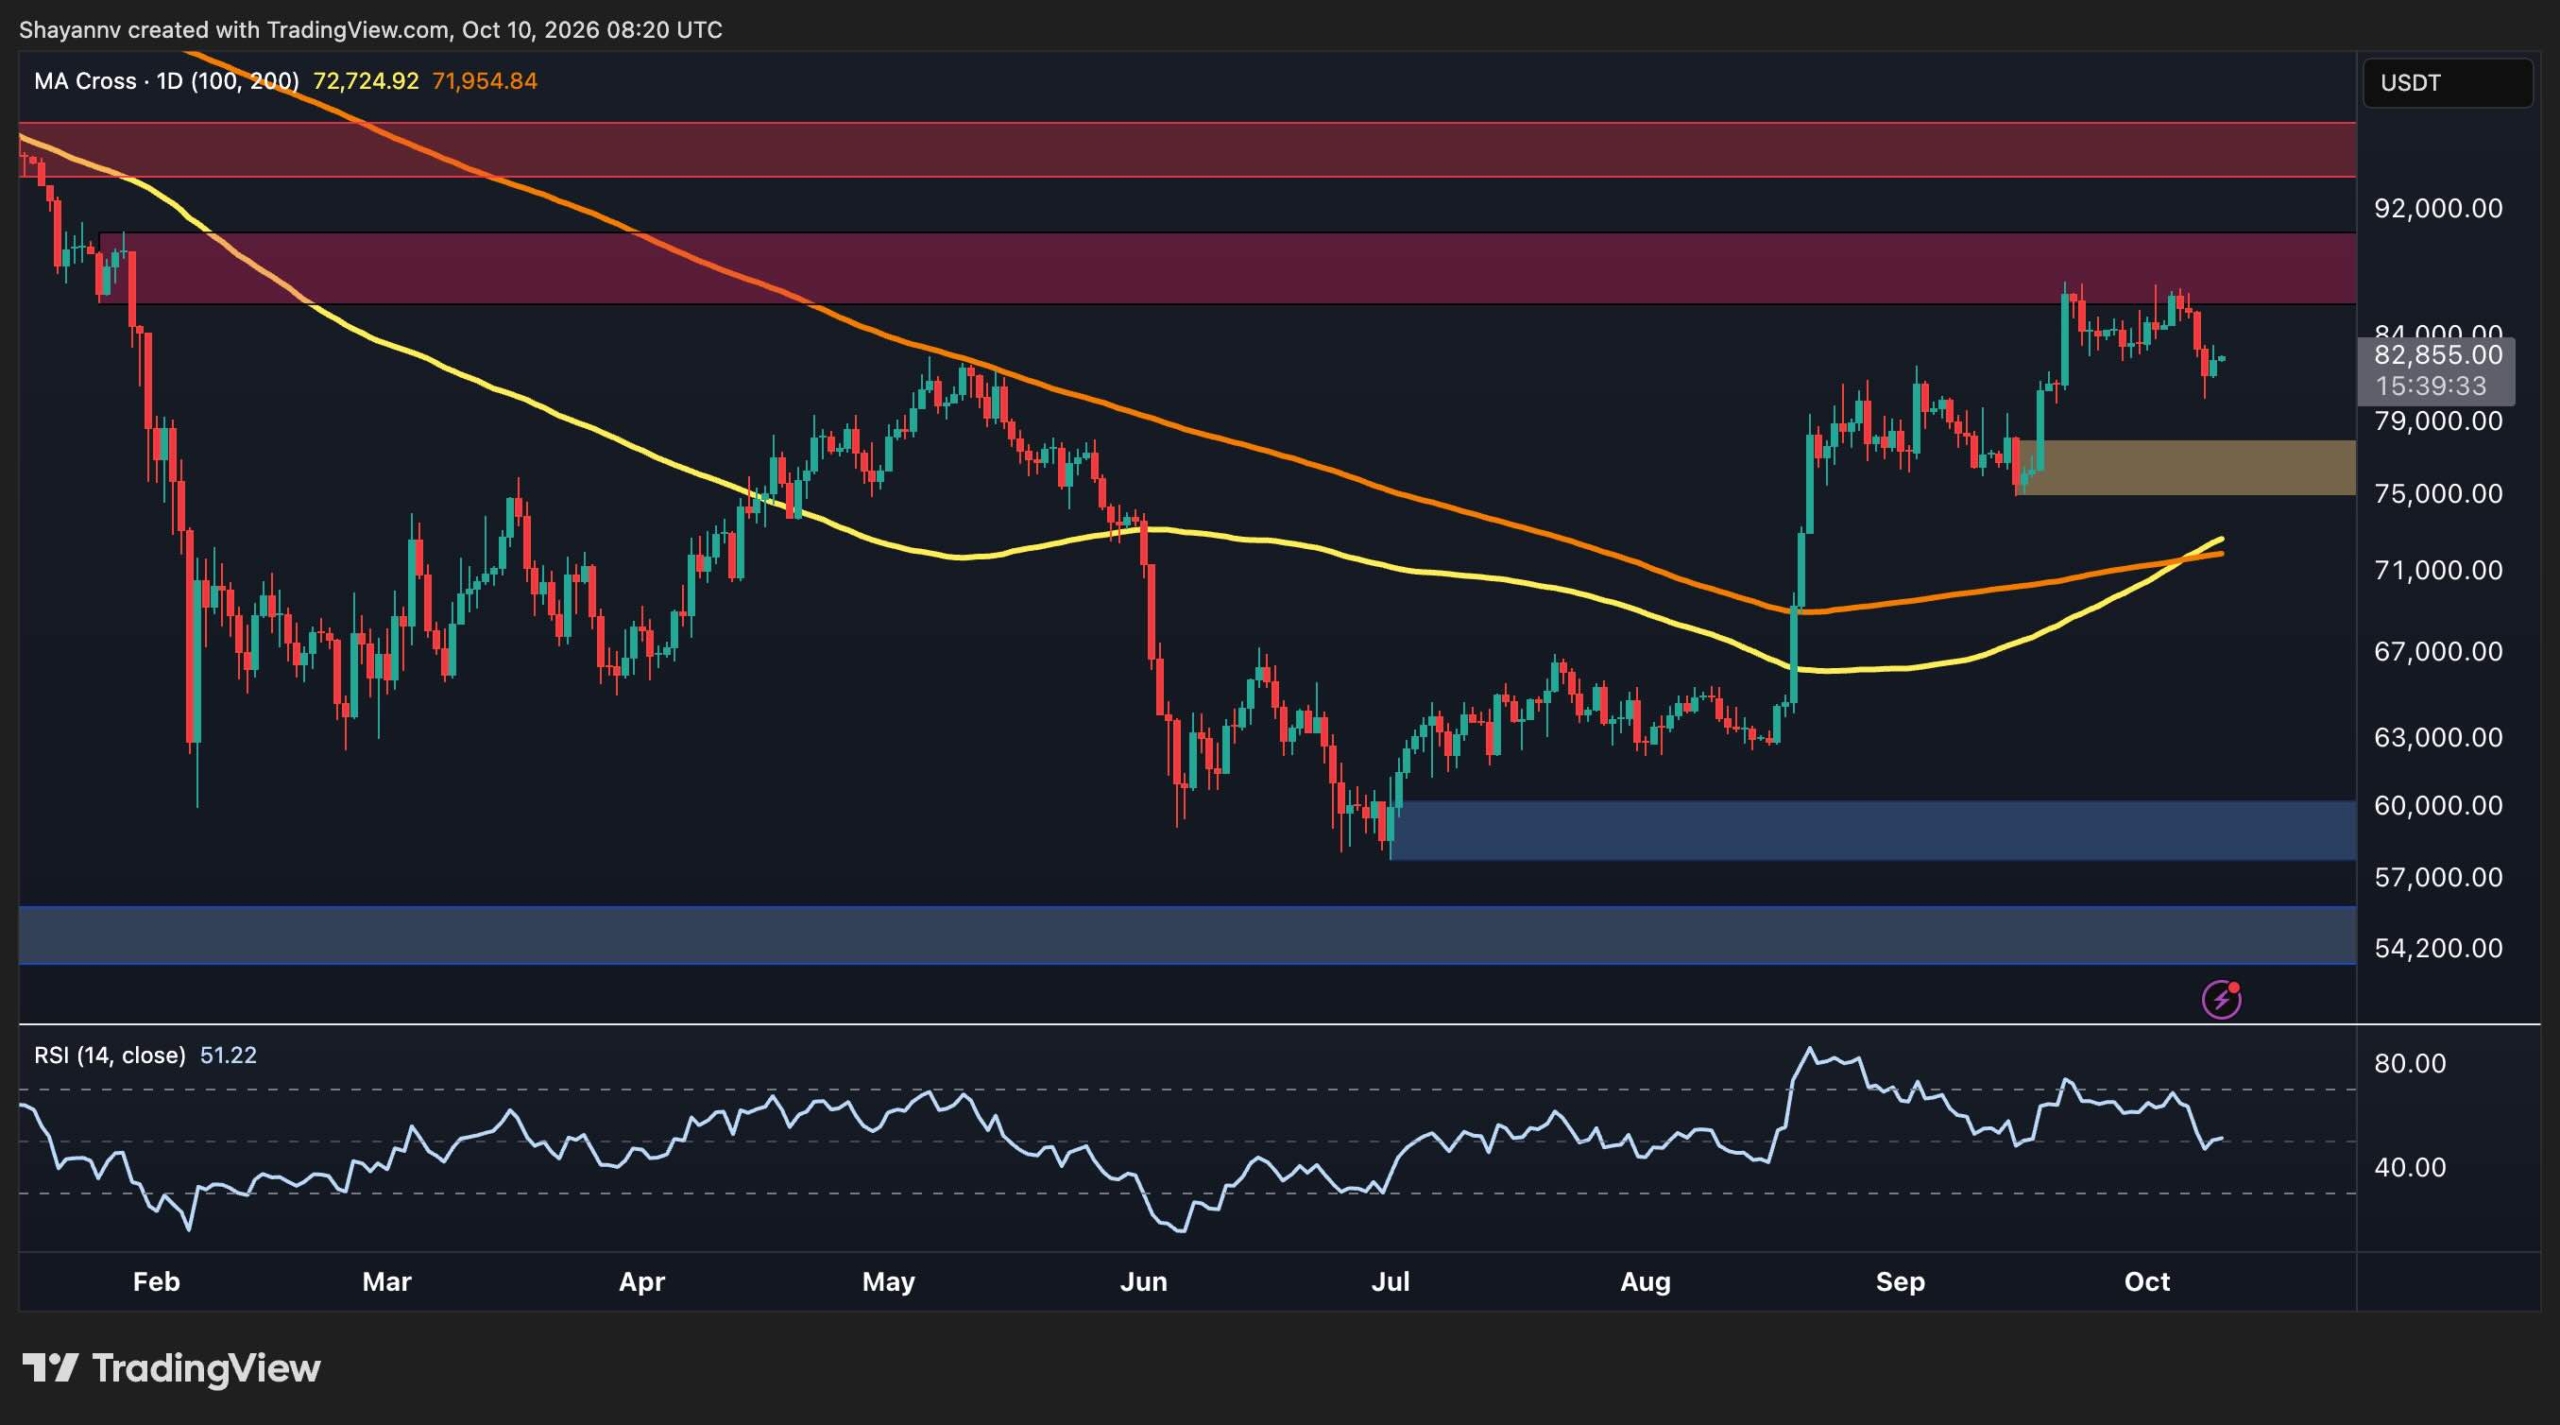
Bitcoin pulled a sick recovery from those June lows near 58K up to the highs around 86K. Yet this rally slammed into heavy resistance and the fresh price action screams sellers are taking the wheel short term 🕷️. BTC got rejected hard at the 86K to 90K zone with 86K acting as the next big wall to climb over. A wider resistance sits near 95K if things heat up again 😌. Price still floats above the 100-day and 200-day moving averages chilling near 72K after a bullish crossover. This setup shows better medium-term vibes post-summer bounce but those averages could turn into key support if the dip gets deeper 🌚. The first big downside spot to watch is the 77K demand zone from that bullish order block. Losing it with a close under 75K would crack the recovery and open doors to those moving averages around 72K.

The daily structure stays in recovery mode for now but that resistance rejection plus possible loss of short-term support means Bitcoin might need a deeper correction before any fresh push 🌹.

Zooming Into The 4-Hour BTC Moves 🦇

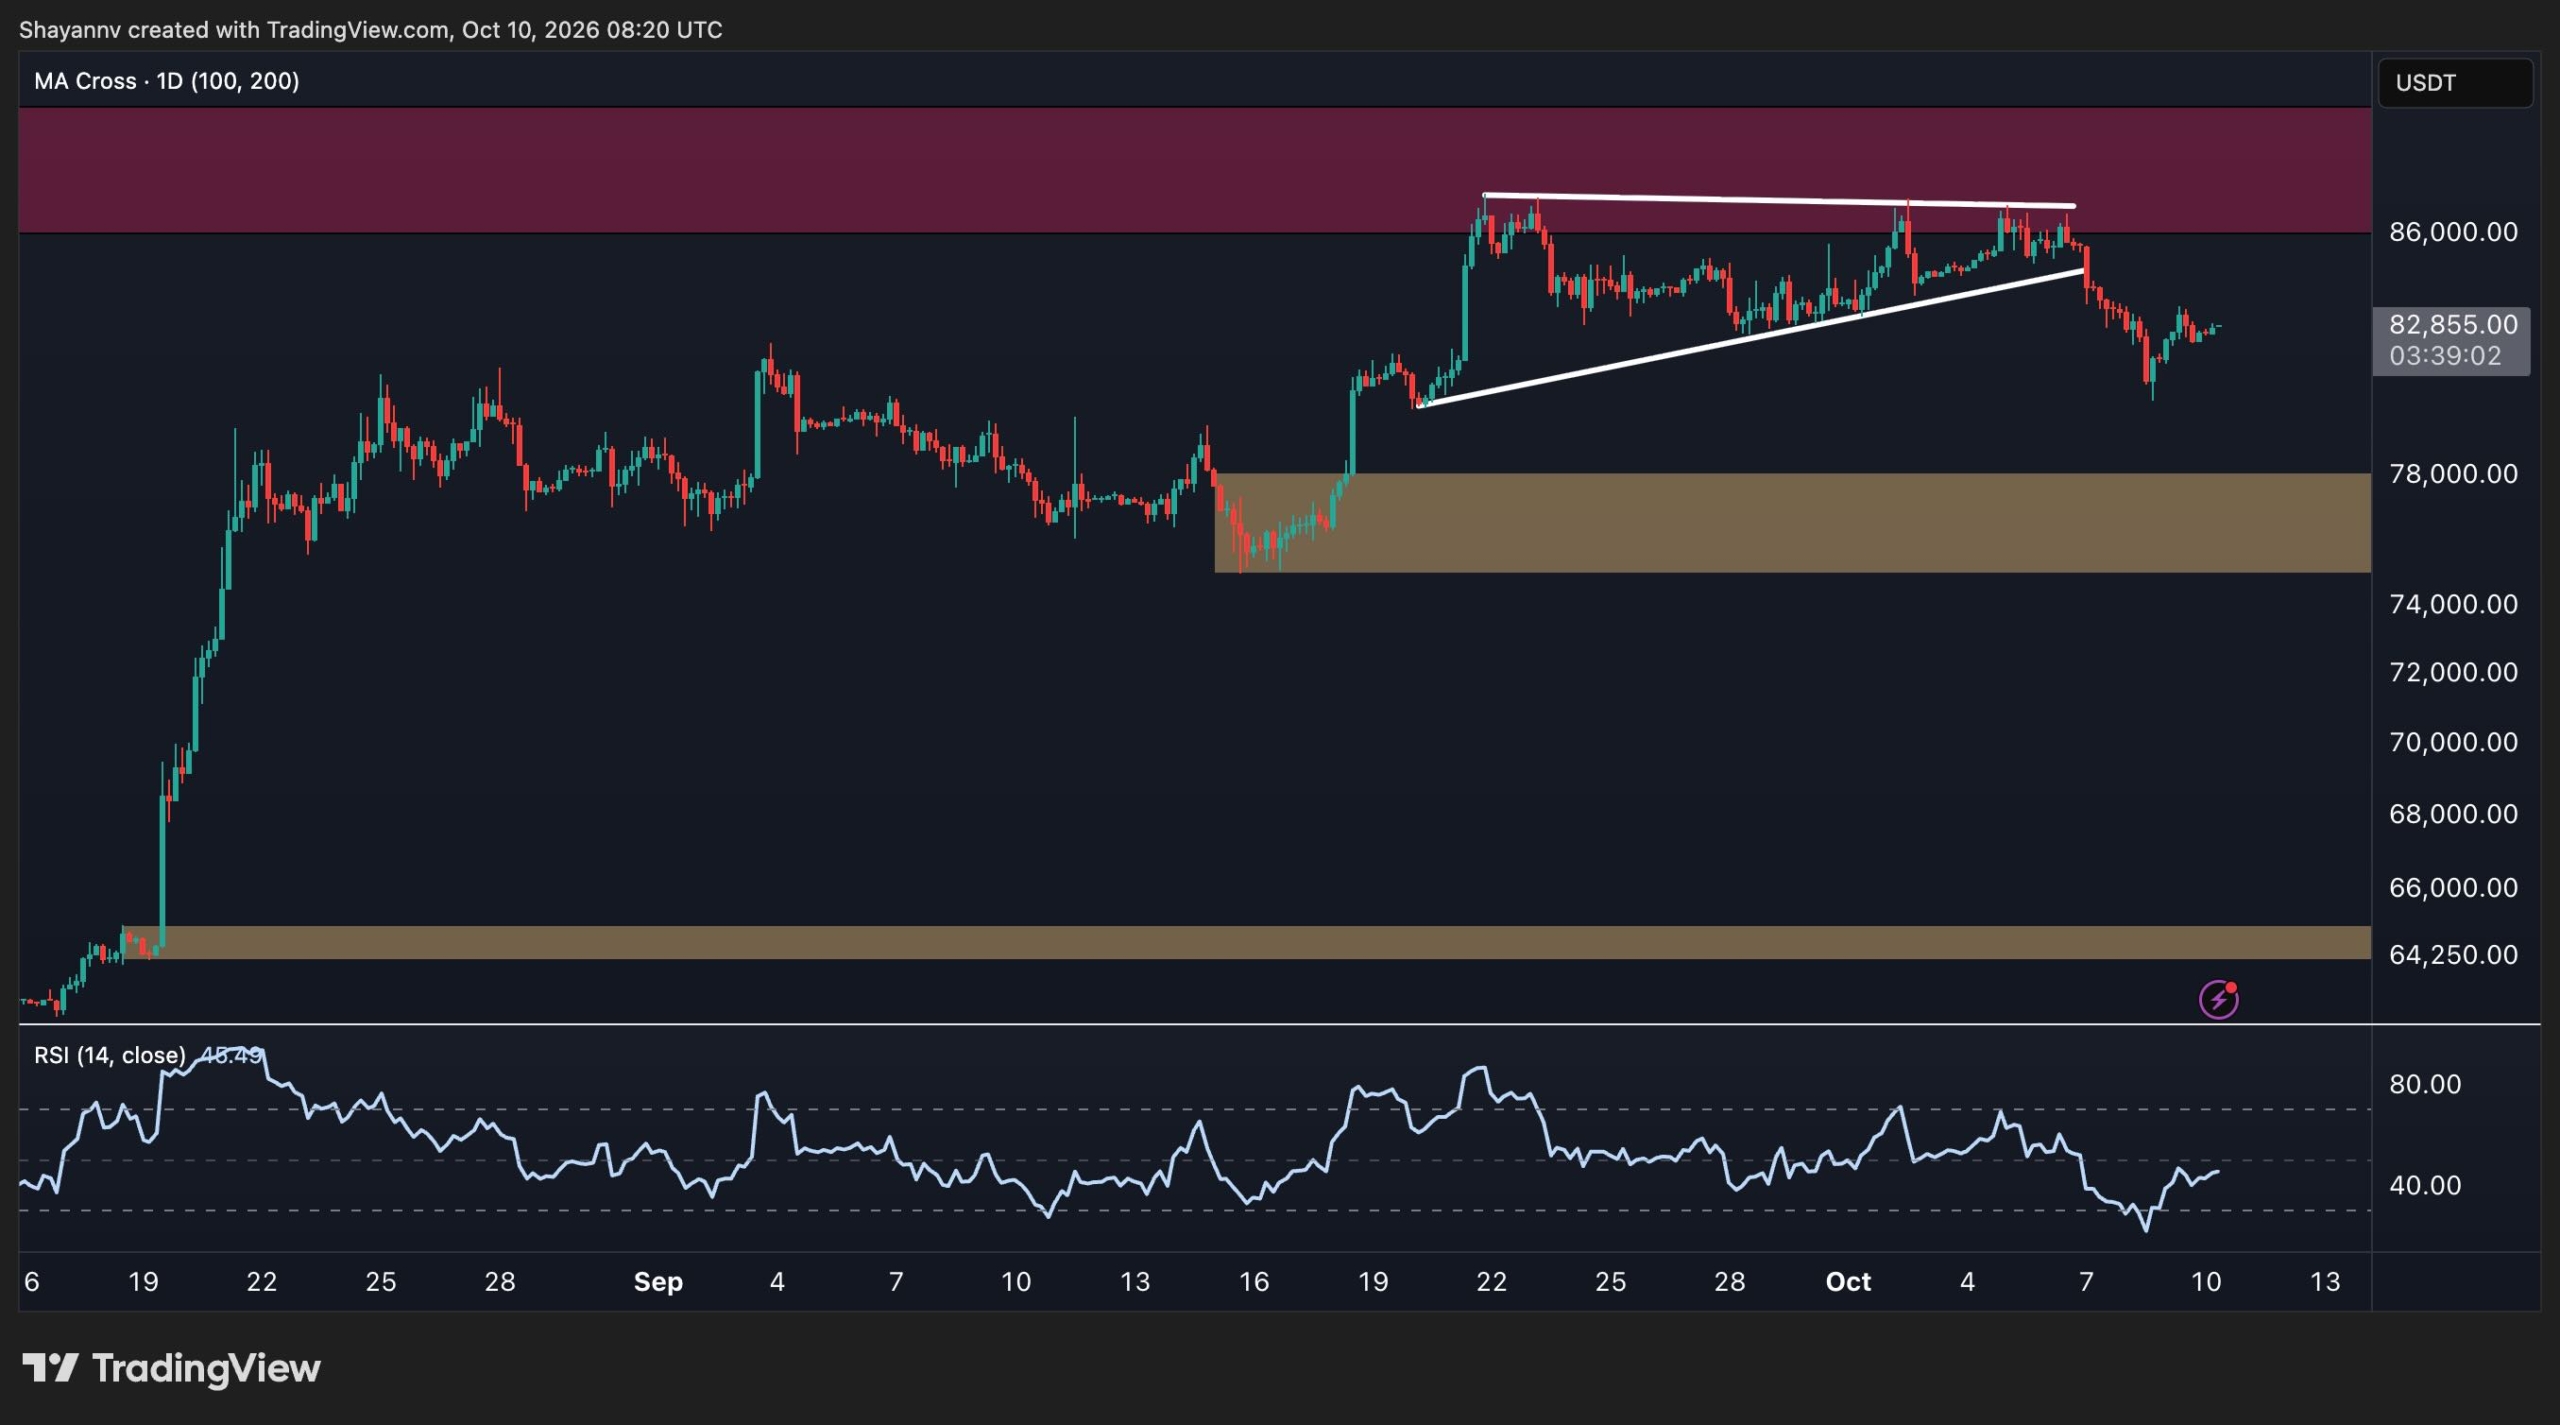
On the 4-hour chart BTC broke under a rising wedge right after the 86K rejection. That breakdown signals a short-term bearish resolution at least for now 💉. After dropping toward the 80K area it staged a modest rebound to 83K as buyers try to keep things steady. Still the bounce looks capped by a bearish order block near 85K that could drag price lower again. The 80K low is the nearest defense line and losing it points to the 75K to 78K demand zone next. The 4-hour RSI climbed from oversold into the mid-40s easing some sell pressure but it sits below neutral at 50 so no strong bullish momentum yet 😈. Short-term outlook stays cautious with possible consolidation around 82K to 84K if lows hold. Another rejection under 86K and break below 80K raises odds of a deeper dive to that 75K to 78K area.

US Demand Vibes Turning Sour 🌚

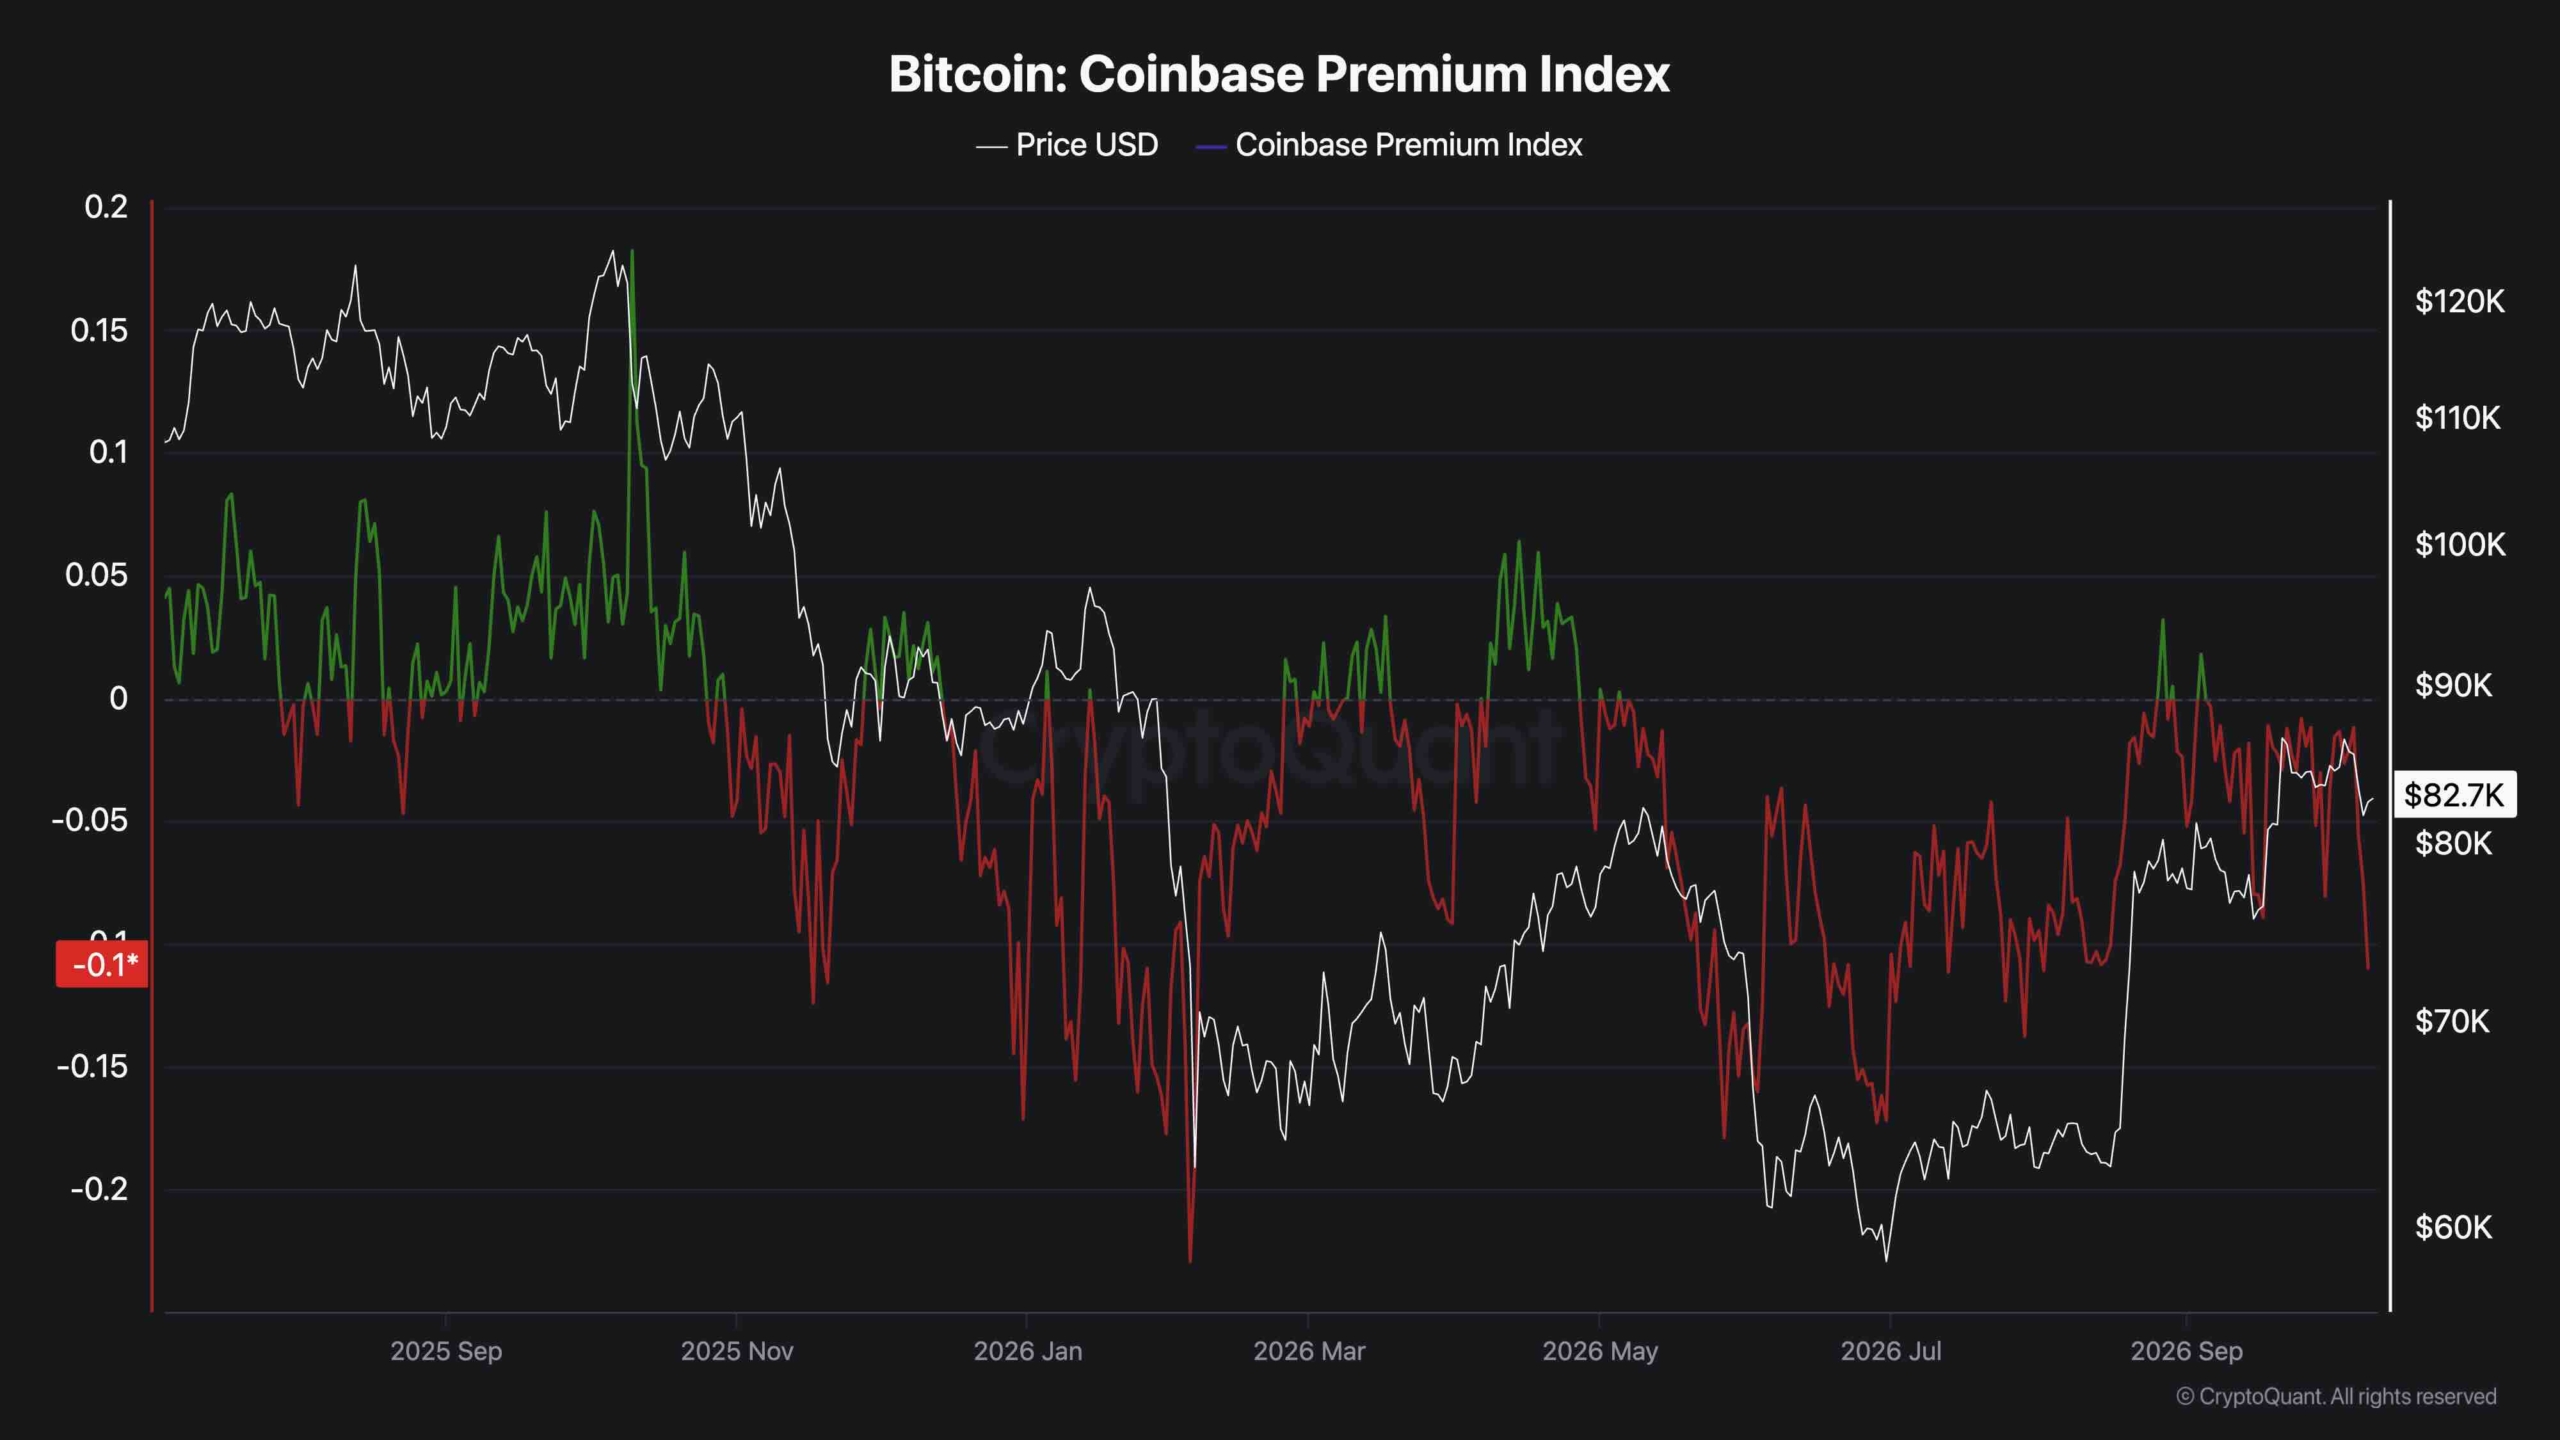
The Coinbase Premium Index just flipped sharply negative down to about -0.1 as Bitcoin trades near 82.7K. This metric tracks the price gap between Coinbase and broader markets with negative readings showing BTC discounts on Coinbase. A negative shift often points to softer US spot demand or extra selling pressure there 🖤. The drop lines up with the recent rejection from 86K and the 4-hour wedge breakdown so spot buying might lack the juice for an instant rally continuation. The index swings between positive and negative often so this alone isn’t full proof of big distribution. Still a sustained negative premium plus more price weakness would strengthen the bearish case especially if 80K support breaks.


Just another echo from the void by iconofsin.eth 💖


Maybe you like what i'm doing here and wanna support me via the ethereum blockchain: iconofsin.eth 💖

Eth’s Wild Crypto Path: Rebound Or Slide To 2K? 🌑🕸️

Ethereum’s hovering near 2.5K rn after that brutal correction from the 2.7K resistance zone and it’s squeezing a crucial support level pretty hard. While ETH stays glued above its daily 100-day and 200-day moving averages the momentum’s definitely fading and that little bounce in exchange supply ratio has me thinking traders need to stay sharp for extra volatility before we crown any bigger recovery. 😈

Daily Chart Drama Unfolding For ETH 🖤

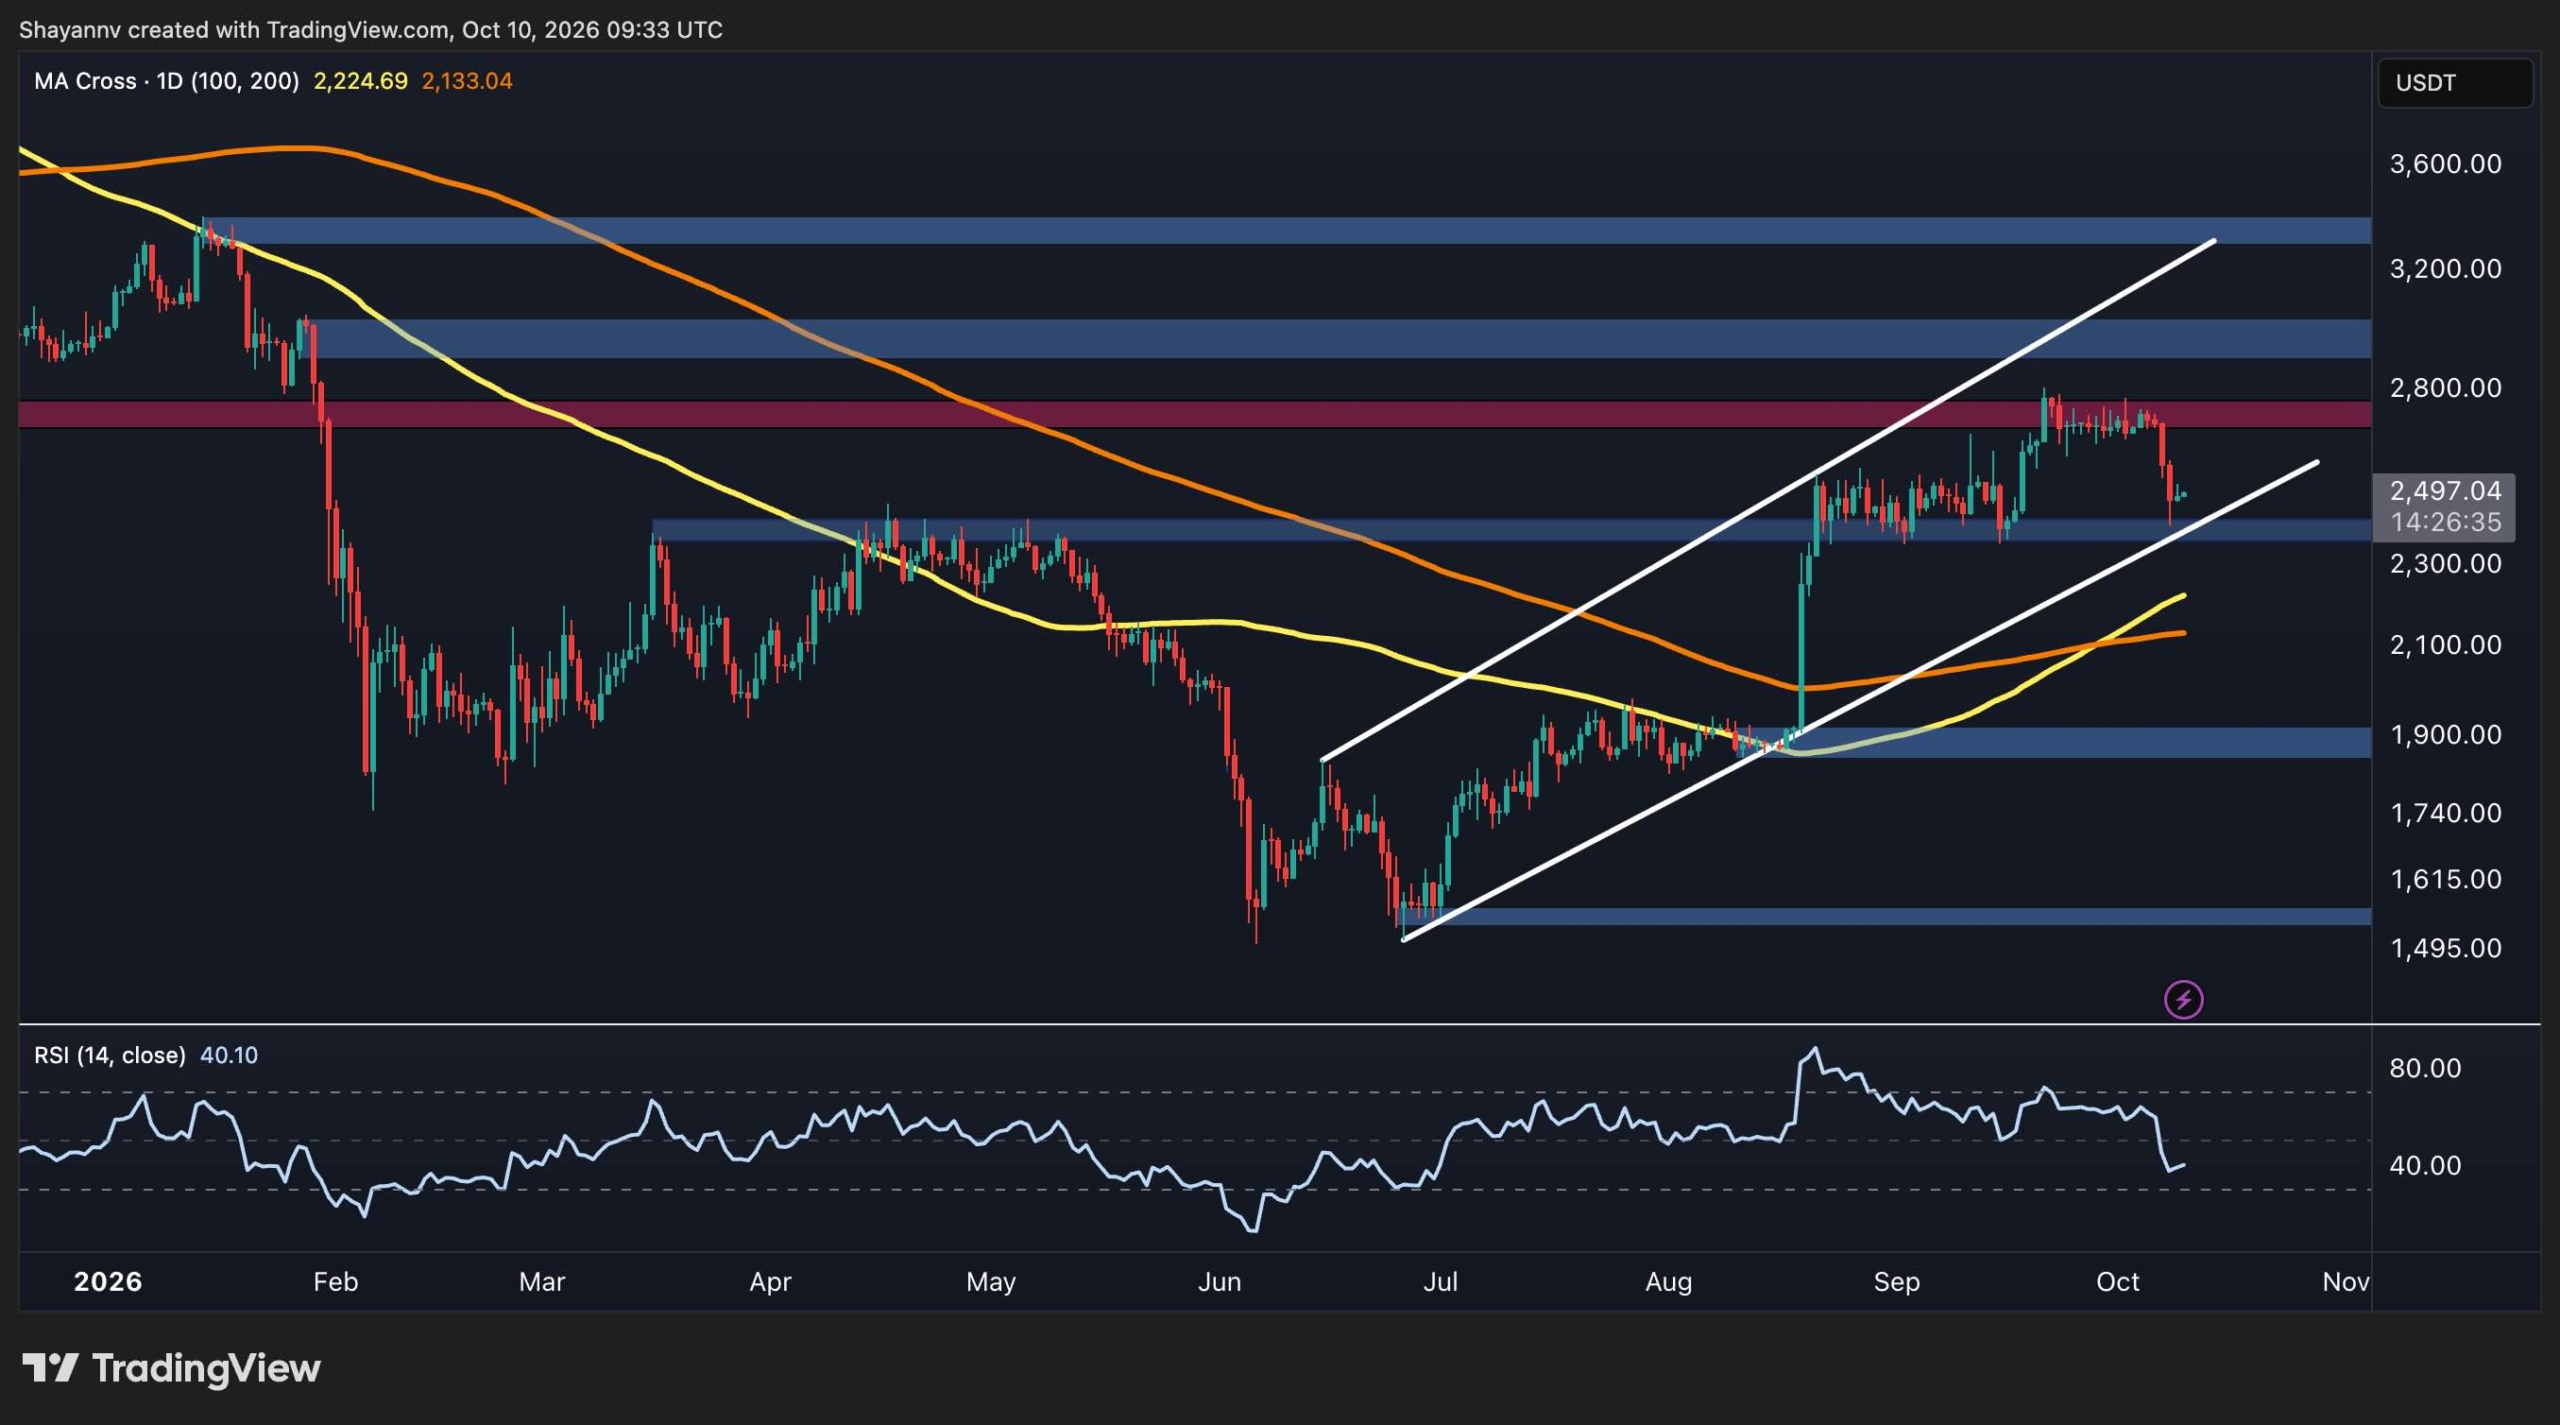
Ethereum’s daily chart paints this wild recovery from the June lows around 1.5K then a fiery rally that blasted it past the 2K mark straight into 2.4K territory. ETH pushed all the way up to that 2.7K resistance but sellers snatched control back early October.
The fresh rejection at the 2.7K supply wall dragged price back toward 2.4K as immediate support. Buyers are poking around after yesterday’s wick through the floor but the bounce feels kinda shy and isn’t screaming bullish reversal yet. 🔥
If this 2.4K zone holds ETH might claw back toward that major 2.7K ceiling. A clean break above could flip the short term structure bullish and maybe crack the door to 3K.
Yet a firm daily close under 2.4K would shatter the recovery vibe since the ascending channel from June would snap lower too. Next key support zone sits around 2K to 2.2K where those 100 and 200 day averages just crossed bullish. 💀
The RSI slipped down to about 40 hinting at fading momentum and a tilt into bearish turf. It’s nearing oversold but hasn’t dipped below 30. A climb past 50 would show buyers flexing again while staying weak under 40 leaves ETH open to another support test.

Four Hour Chart Shows Fresh Sell Pressure 🌹

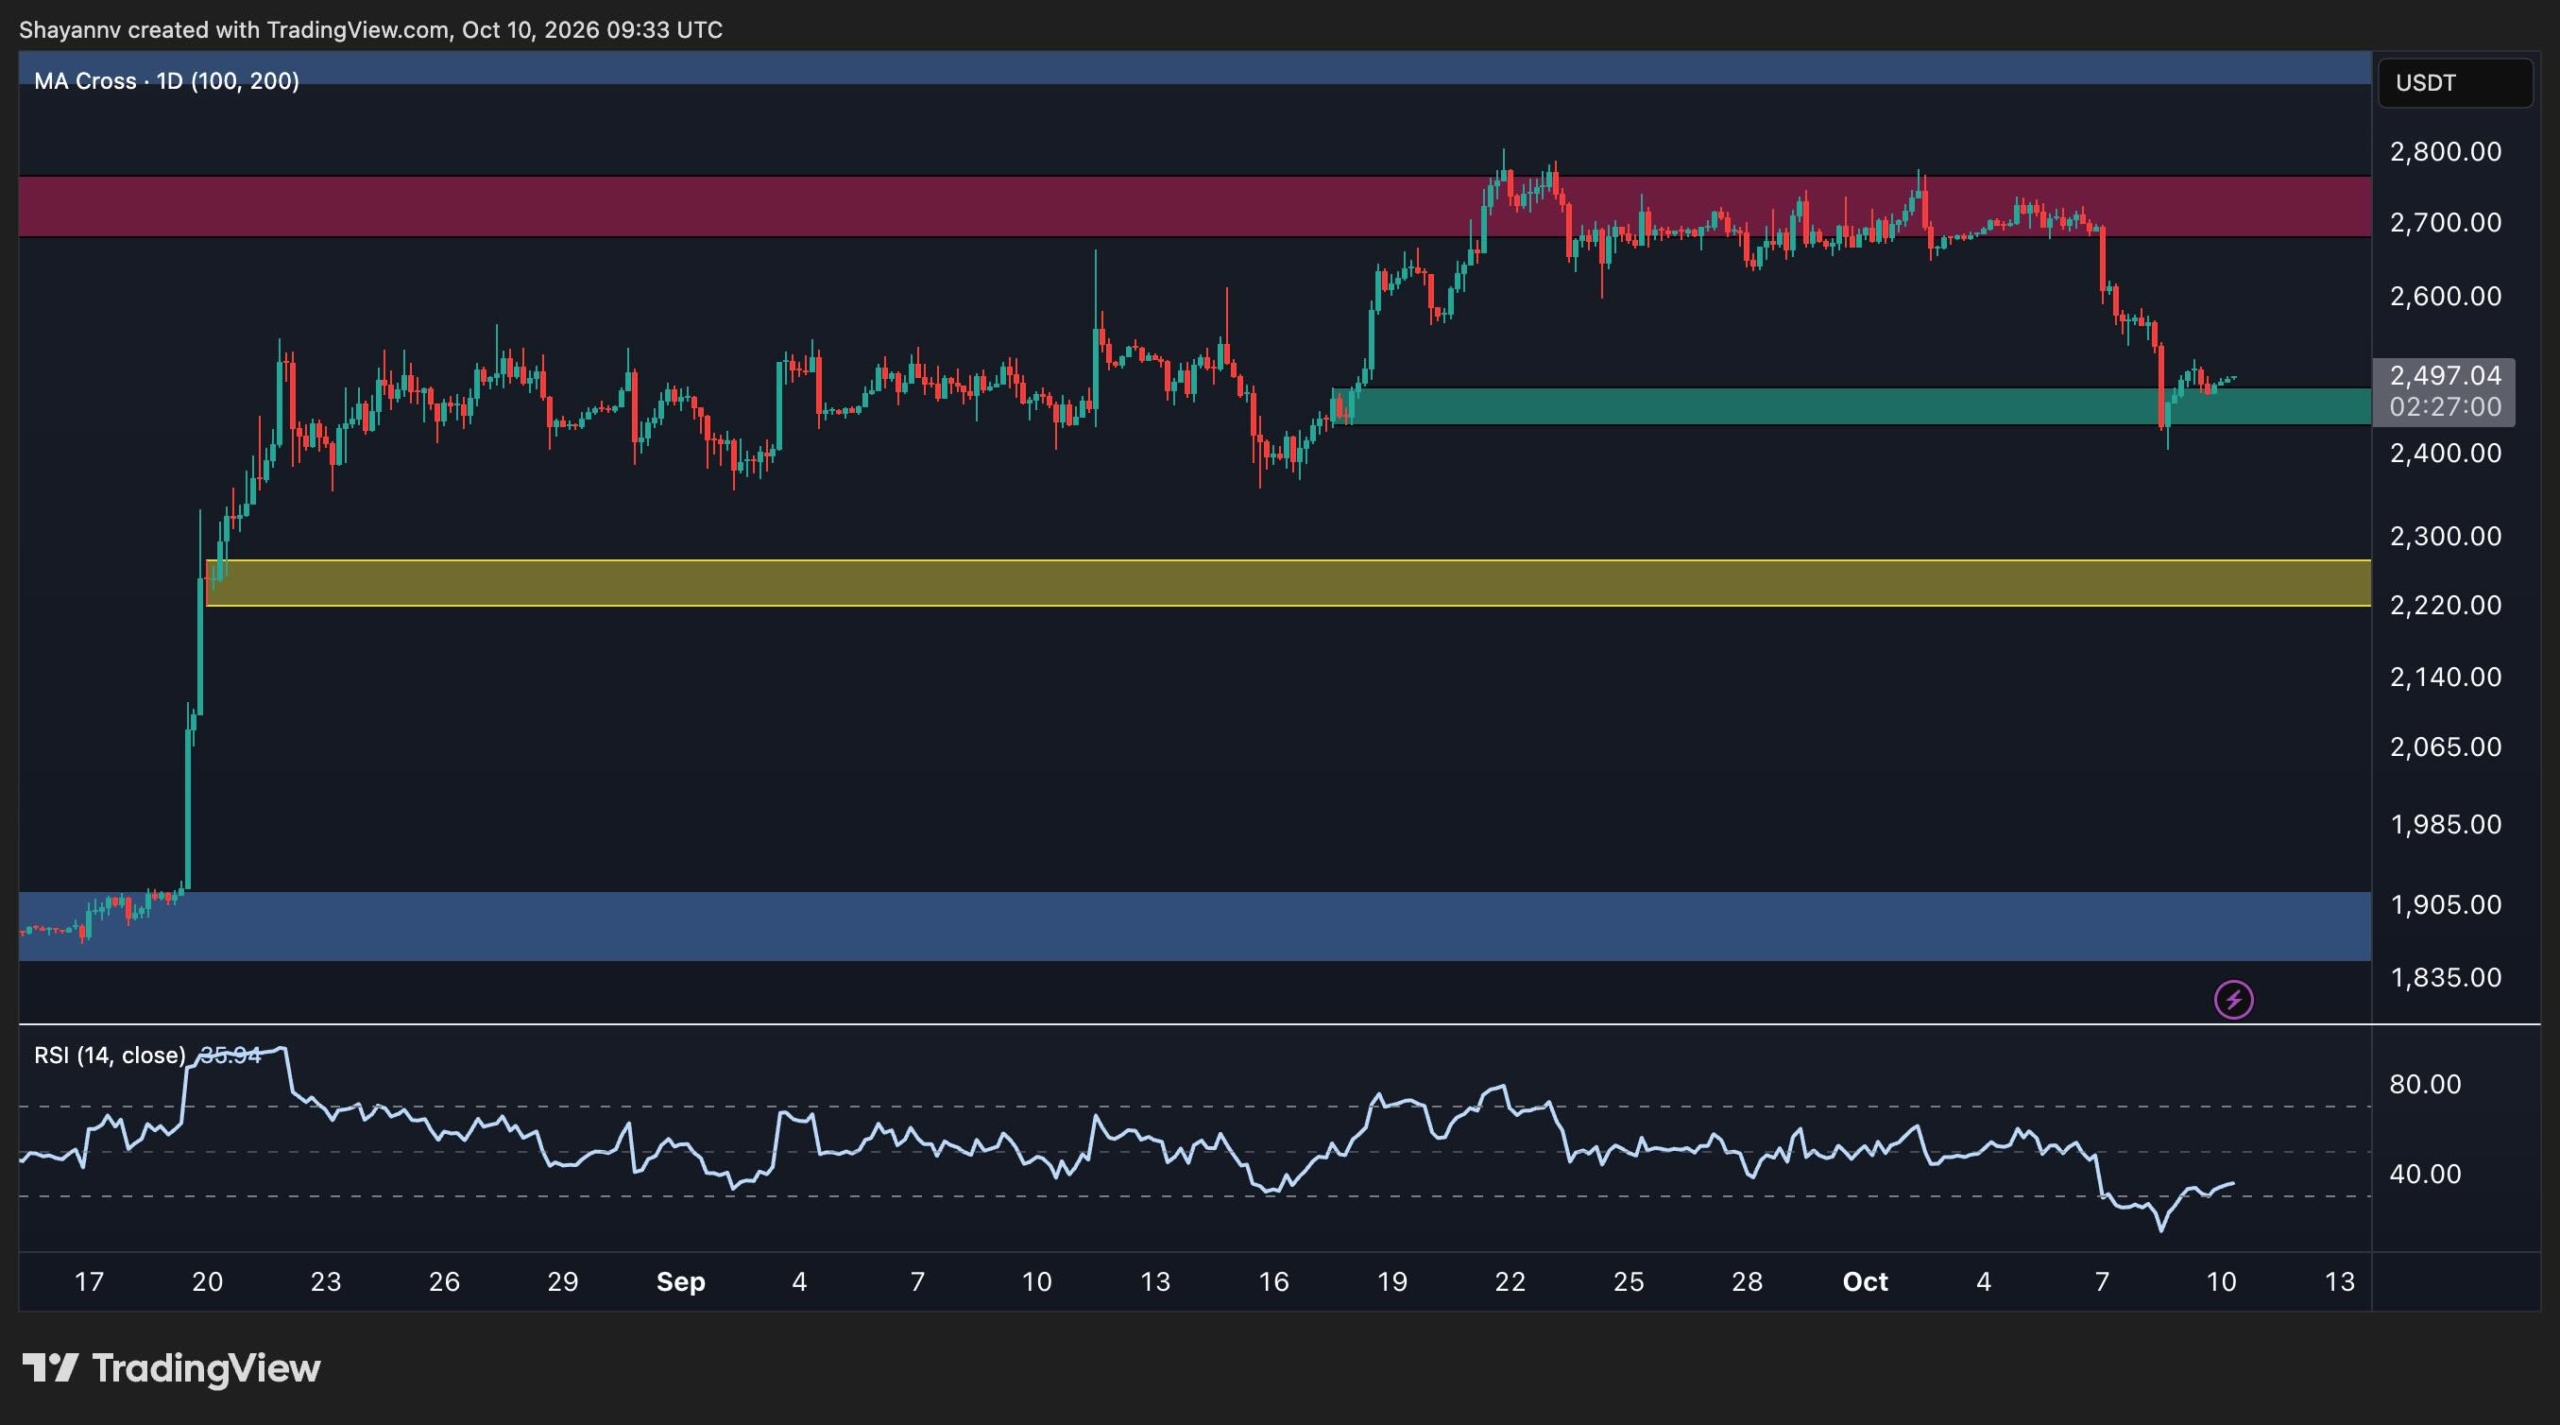
The 4 hour view makes the recent selling wave super clear. Ethereum chopped sideways between roughly 2.6K and 2.8K through late September before crashing lower in a hurry this week. The drop picked up speed once 2.6K gave way and price slid toward 2.4K.
Latest candles reveal a modest lift back to 2.5K after those sharp drops so buyers are testing the waters around support but the rebound stays too tame to declare the correction finished. 🕯️
Immediate resistance lives between 2.6K and 2.7K where ETH would need to clear that bearish imbalance from the fall. Below the 2.4K zone comes first for watching and a break could drag things toward the wider 2.2K area.
Meanwhile the 4 hour RSI popped from deeply oversold up to around 40. Selling looks like it might be easing yet momentum still feels soft under the 50 line. Strength here plus price action would back a real recovery.

On Chain Moves Raise Eyebrows 🦇

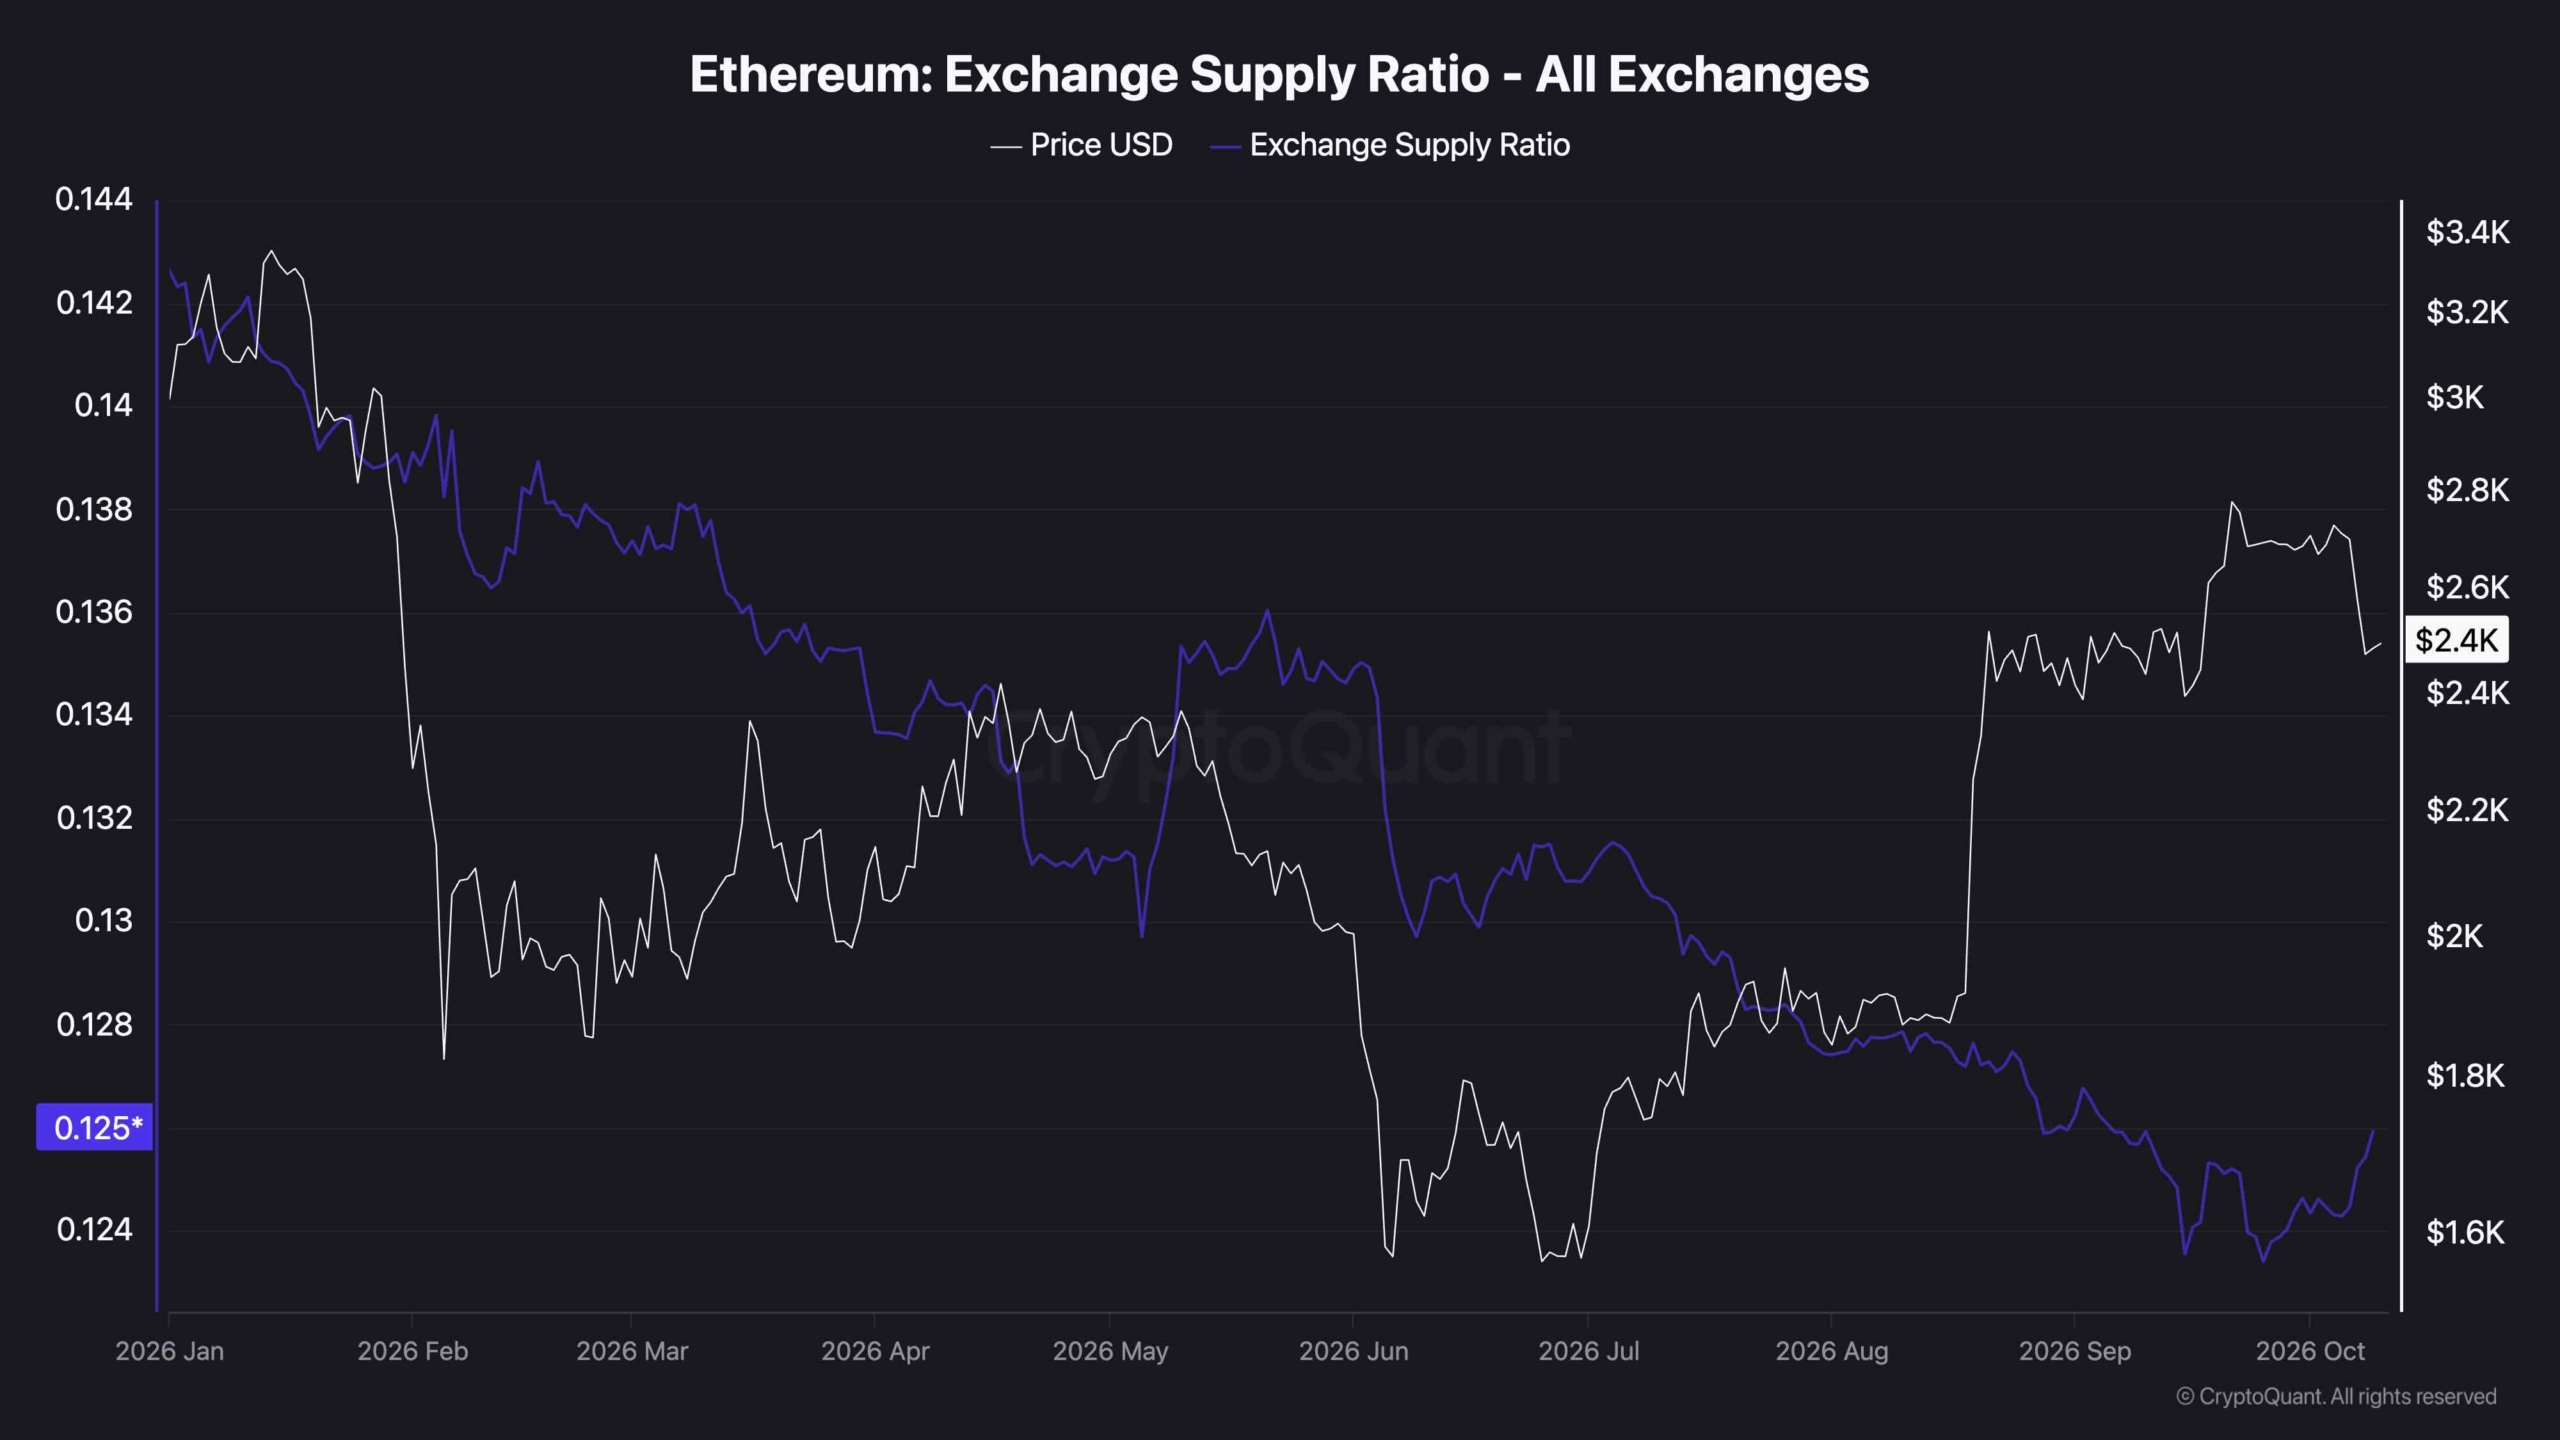
The exchange supply ratio tracks how much of Ethereum’s circulating supply sits on centralized exchanges versus the bigger picture. It hints at shifts in ETH ready for trading though it doesn’t prove intent to sell.
The chart reveals a steady drop in that ratio through most of 2026 falling from about 0.142 early in the year down to 0.124 by September while price climbed toward 2.7K.
That trend feels telling since less ETH on exchanges can line up with accumulation or self custody moves shrinking immediate sell pressure. Still the chart alone can’t confirm why it’s happening. 🪦
Lately though the ratio ticked back up from those lows in a modest way worth watching next to ETH’s recent dip. If it keeps climbing while price stalls under 2.7K it might mean more supply is flowing back onto exchanges which could fuel extra sell liquidity and push price lower if demand doesn’t step up.


Just another echo from the void by iconofsin.eth 💖


Maybe you like what i'm doing here and wanna support me via the ethereum blockchain: iconofsin.eth 💖

A Year After Crypto’s Fiercest Liquidation Frenzy: Bitcoin Still Lingers Below Its Peaks 🖤🕸️

October’s got this killer rep in crypto as Uptober, that magically green month historically packed with fat gains fr. 💰 Last year’s edition hit different tho. Btc mooned straight to its fresh all time high near $126,000. But then it crashed through the biggest liquidation nightmare ever. This weekend marks one year since that pain train. 🖤

A Spooky Date We Can’t Forget 😈

Right before October 10 Btc was ripping higher earning that Uptober glow up. The record spike landed on October 7 just over $126,000. Analysts and die hard bulls started screaming about $200,000 or even $500,000 targets by year end. The truth hit way harder tho. On October 10 2025 escalating trade drama plus insane leverage sparked a brutal sell off. Total wrecked positions smashed past $19 billion in just one day. Bitcoin nose dived from $122,000 down to $105,000 on most spots and even $101,000 elsewhere. Over 1.6 million traders got rekt outta nowhere. 🕸️ That drop felt extra savage since it came only 48 to 72 hours after the fresh high above $126,000. Today that level feels like total fiction rn.

Still Healing In This Weird Market 🌙

That epic crash kicked off a long bear phase that bottomed out below $58,000 on July 1. Bitcoin slid 53 percent in months after the worst liquidation ever. Now it chills around $82,000 to $83,000 down 34 percent from the 2025 peak. 💸 Things look way better than July but some red flags popped up last week when Btc dipped from $87,000 to $80,400 before bouncing back. On the bright side five key indicators just flipped bullish for the first time since 2025. Still that October 10 2025 moment needs remembering. Maybe it teaches folks not to ape all in during green days or panic sell on reds. Last week’s pullback wiping over $1 billion in leverage proves some traders still haven’t learned lol. 🔥


Just another echo from the void by iconofsin.eth 💖


Maybe you like what i'm doing here and wanna support me via the ethereum blockchain: iconofsin.eth 💖