Ethereum remains under pressure across higher timeframes yet the latest price action shows early signs that bearish momentum might be losing strength. While the broader trend stays decisively bearish recent movements hint that sellers could be nearing exhaustion after weeks of sustained downside.
Ethereum Price Analysis The Daily Chart 🦇
ETH’s recent rejection from the $1.72K-$1.78K supply zone sparked another leg lower driving it back into the critical $1.46K-$1.53K demand region. This zone has acted as support multiple times throughout June and keeps drawing buyers whenever price approaches it.
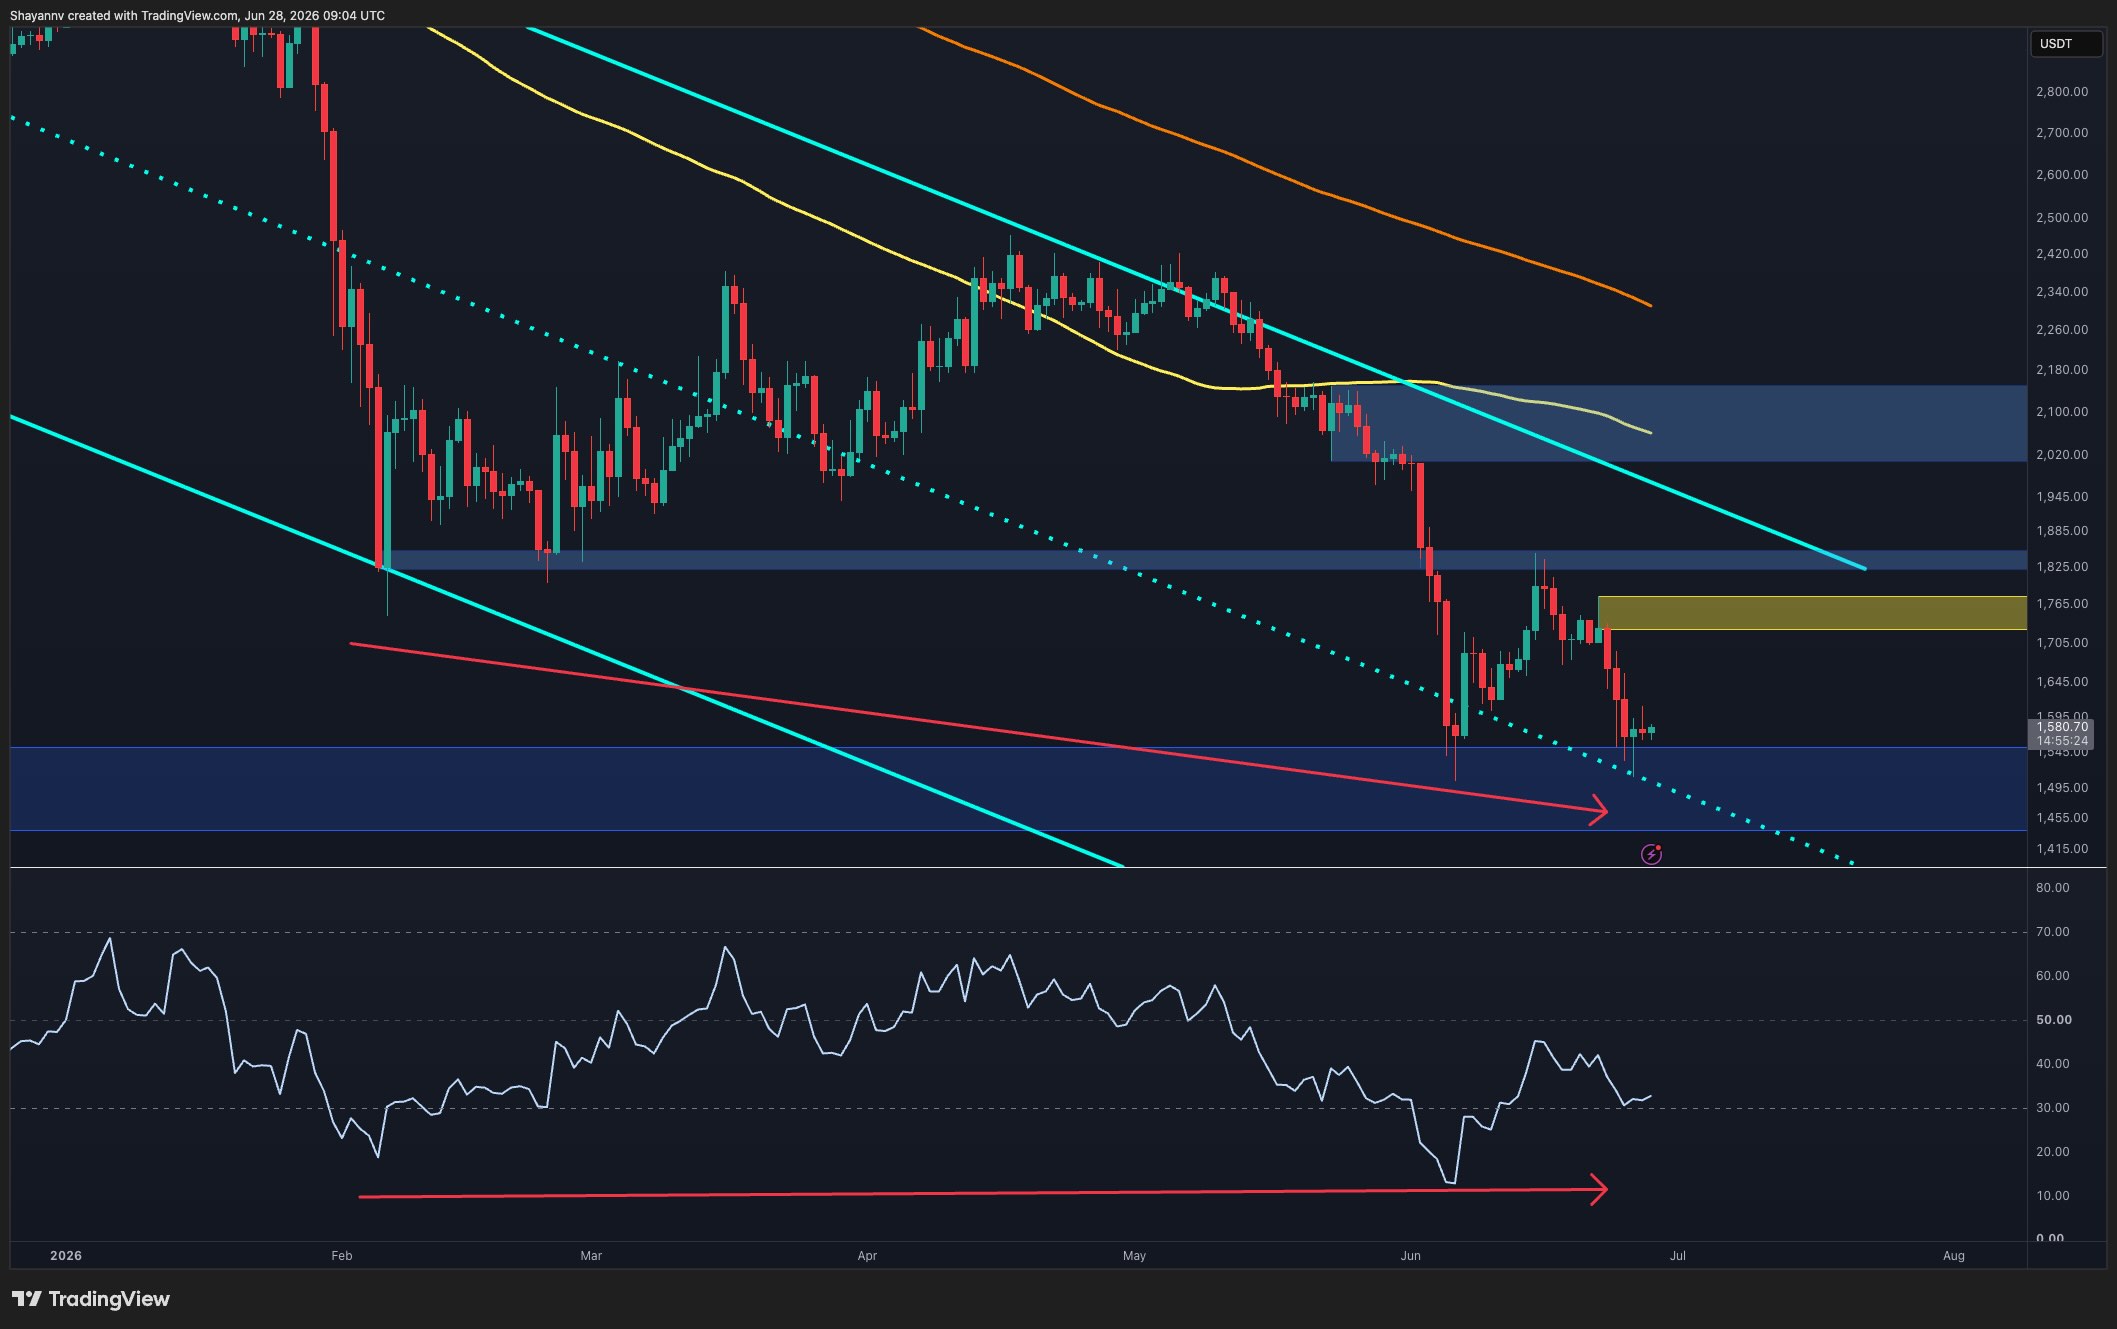
The standout move on the daily timeframe is the emerging bullish divergence on the RSI. While the asset keeps making lower lows during June the RSI forms higher lows near oversold territory. This divergence suggests downside momentum weakens even as ETH sits near cycle lows.
ETH/USDT 4-Hour Chart 🌑
On the 4-hour timeframe Ethereum has spent recent sessions consolidating above the lower demand zone after the sharp sell-off from resistance. A descending trendline has capped every recovery attempt since the June 22 rejection. Yet the asset now compresses right beneath that trendline while volatility contracts further. This setup opens the door for a short-term breakout if buyers push through trendline resistance.
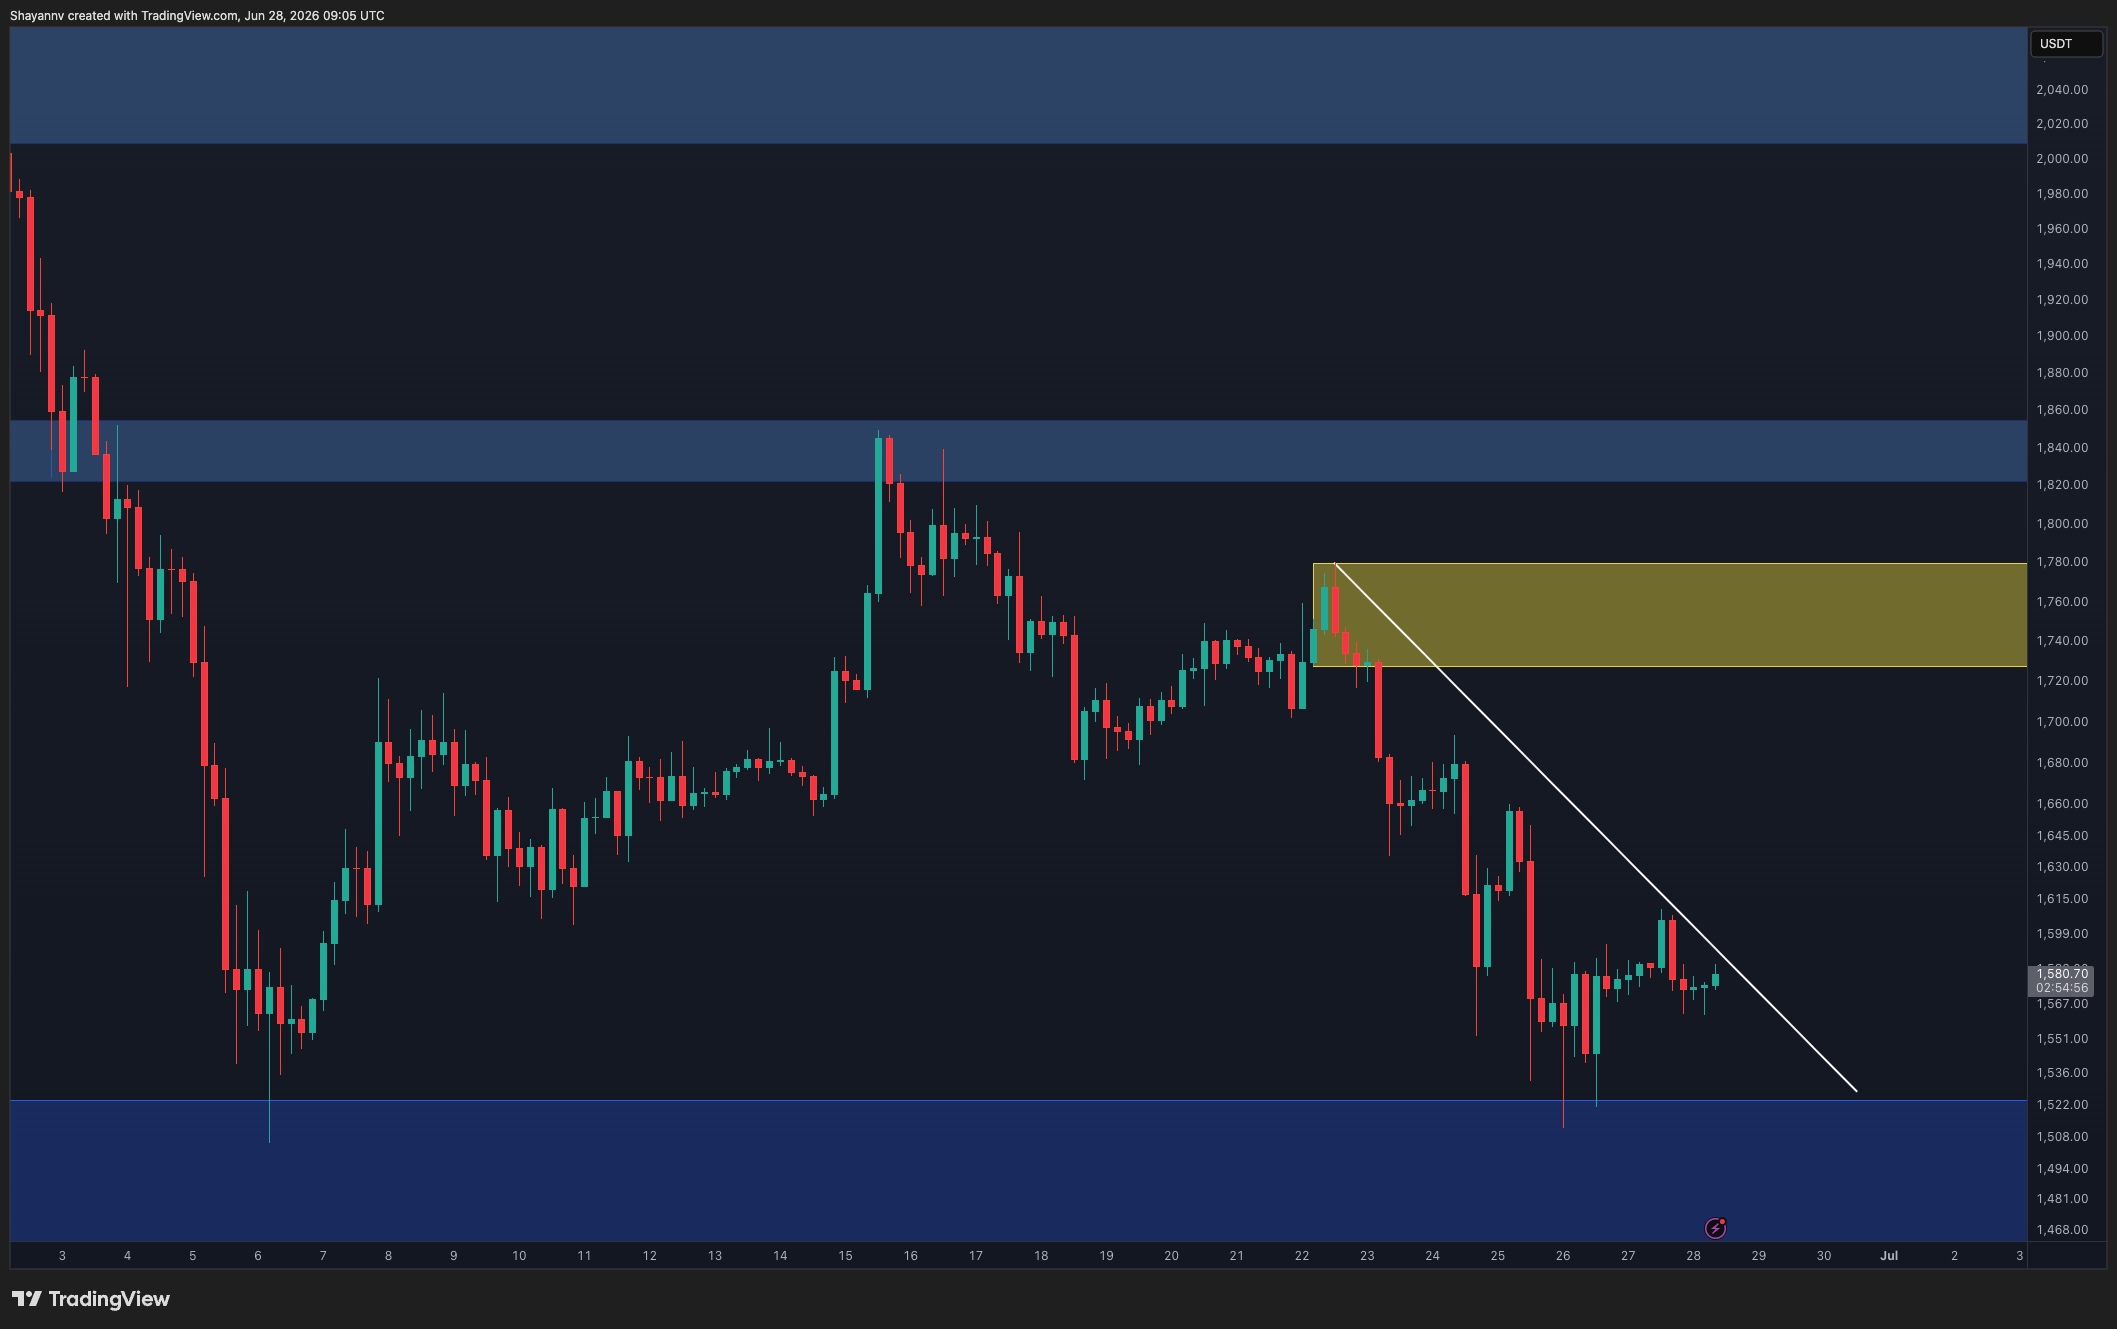
A successful breakout would likely target the $1.72K-$1.78K supply zone which sparked the latest decline. Such a move would align nicely with the bullish RSI divergence on the daily chart and could spark the first meaningful recovery rally in weeks. On the downside the $1.52K area stays the key level to watch. Losing this support would invalidate the short-term bullish scenario and shift focus back toward deeper downside moves.
Sentiment Analysis 🕸️
The liquidation heatmap shows an interesting shift in liquidity positioning. While liquidity clusters above the current price especially between roughly $1.68K and $1.80K Ethereum trades beneath these large pools. Markets often gravitate toward areas with heavy leveraged positioning making those overhead pockets attractive short-term targets.
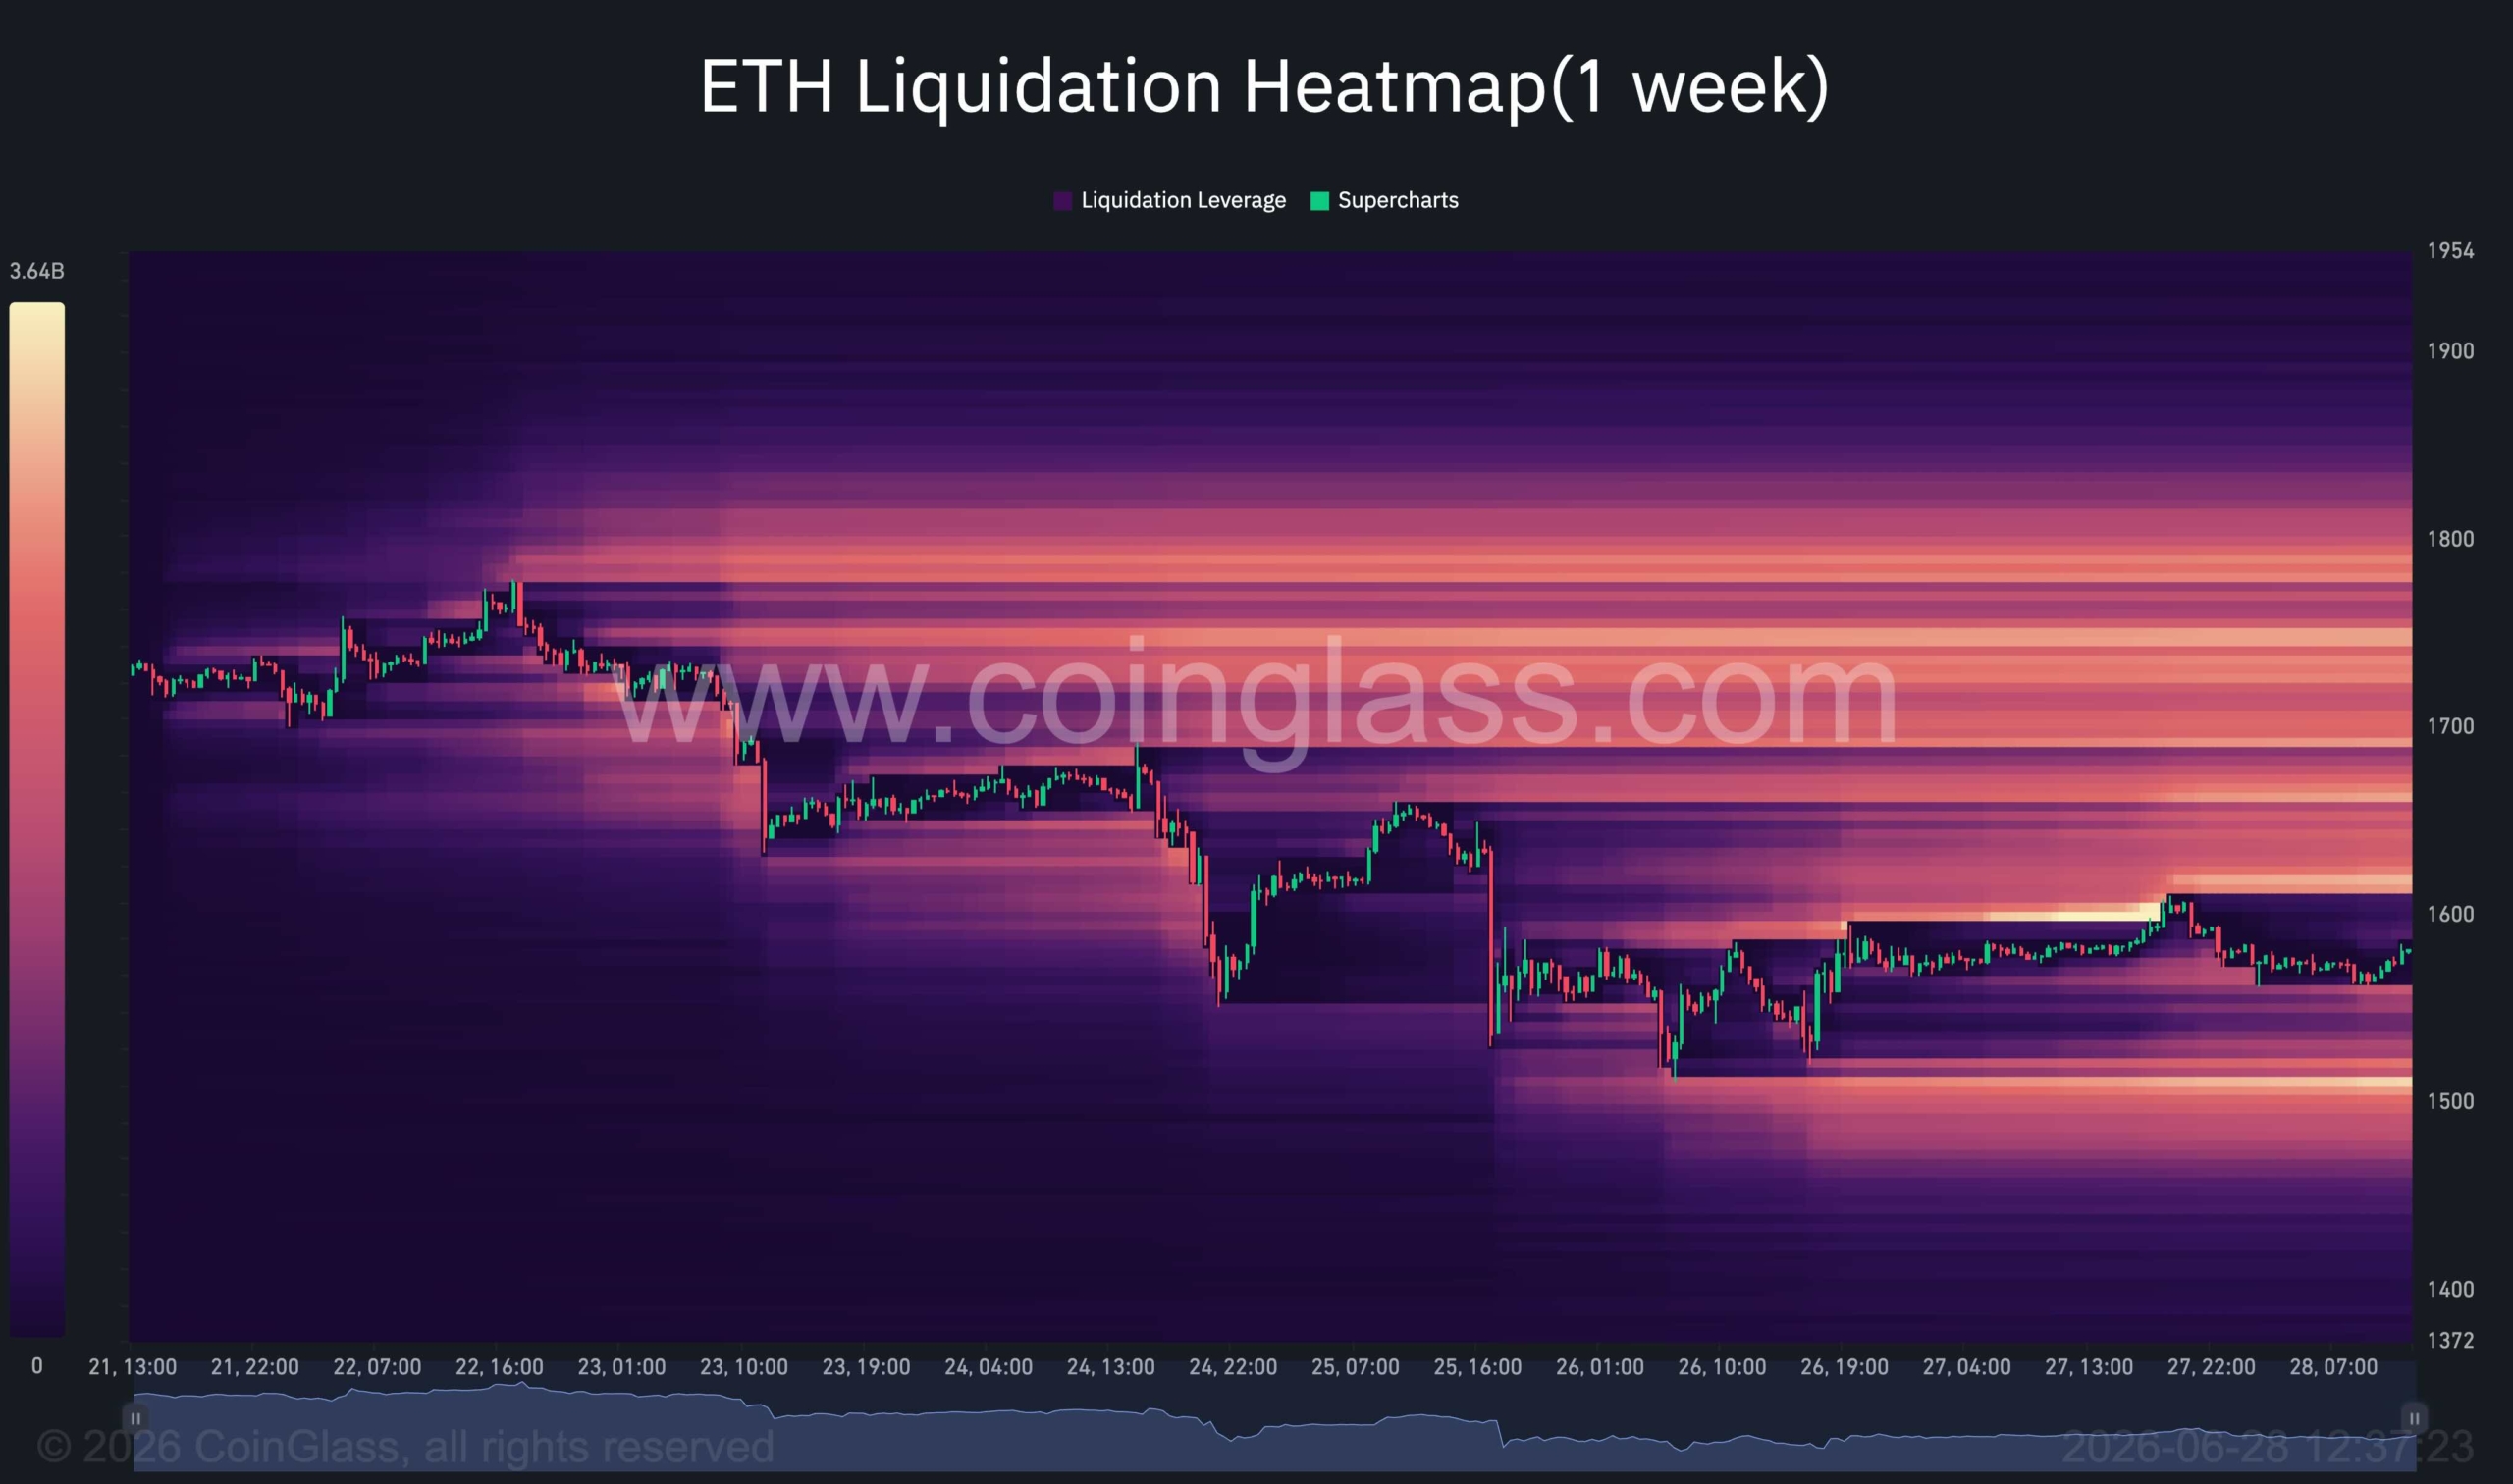
Combined with the bullish daily RSI divergence and compression beneath 4-hour trendline resistance the current setup suggests Ethereum may first attempt an upside liquidity grab before the market decides if a more sustainable recovery can unfold. The reaction around the $1.72K-$1.80K liquidity cluster will likely offer key clues on Ethereum’s next major trend.
Just another echo from the void by iconofsin.eth 💖
