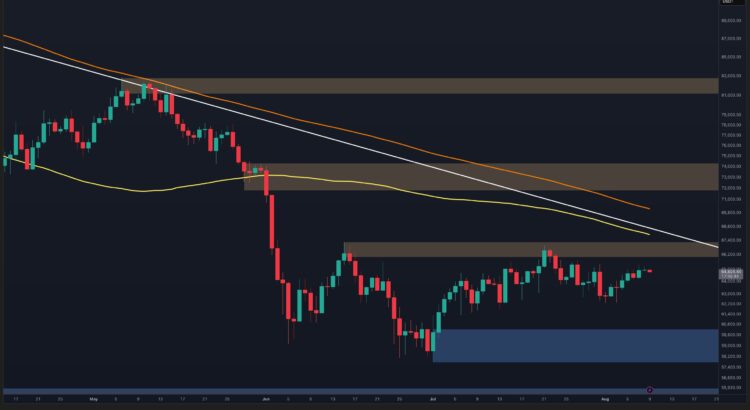
Bitcoin stays stuck in a wide consolidation zone, with the latest bounce failing to spark real bullish drive. The price edges toward overhead supply again, yet buyers haven’t delivered the breakout for a real structural change. 🕸️
Daily Chart Vibes 🔮
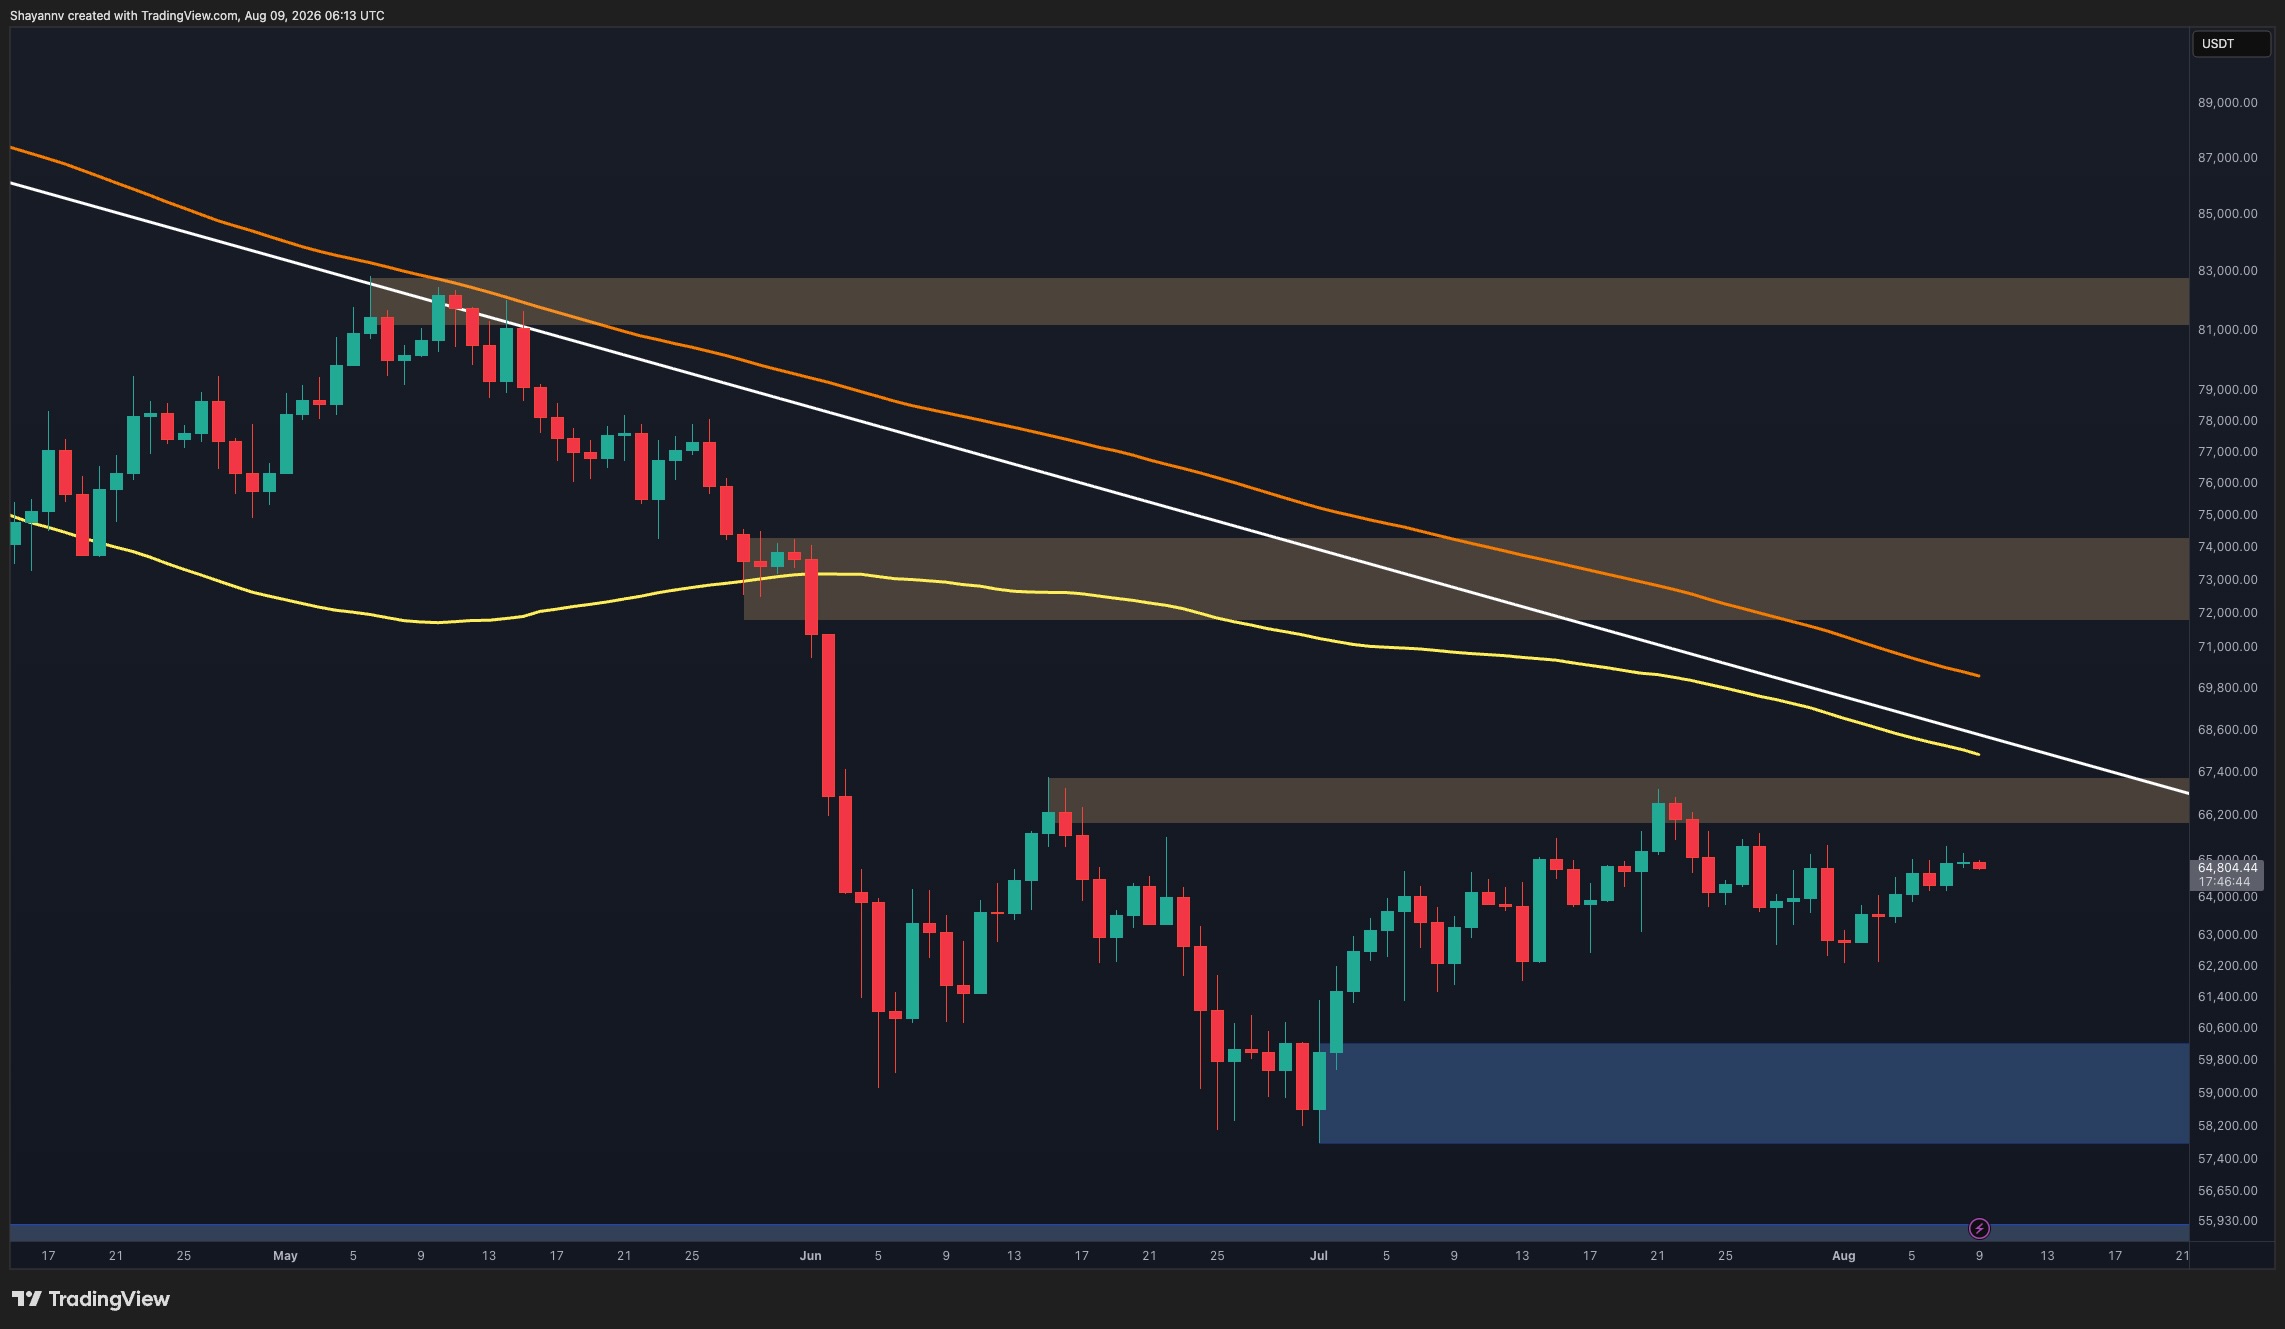
On the daily frame, BTC trades near 65000 after lifting from late June lows. Still the rebound lacks solid bullish push, with recent candles staying tight as price tests the 65800 to 66800 resistance band. This zone already blocked earlier recoveries and now gains extra weight from the falling white trendline. Bitcoin also sits well under declining moving averages, keeping the broader structure tilted bearish even after the pause.
The current lift looks more like quiet holding below resistance than a confirmed reversal. A clean daily break above 65800 to 66800 plus the trendline would brighten the view, while fresh rejection points back to the big 57800 to 60000 demand area.
Hesitant action matches a market waiting on macro and geopolitical updates. Tensions around US Iran and the Strait of Hormuz, plus fresh US inflation figures this month, may trigger volatility. Until a decisive push, Bitcoin could face sharp liquidity swings inside the range.
4 Hour Chart Tension 💀
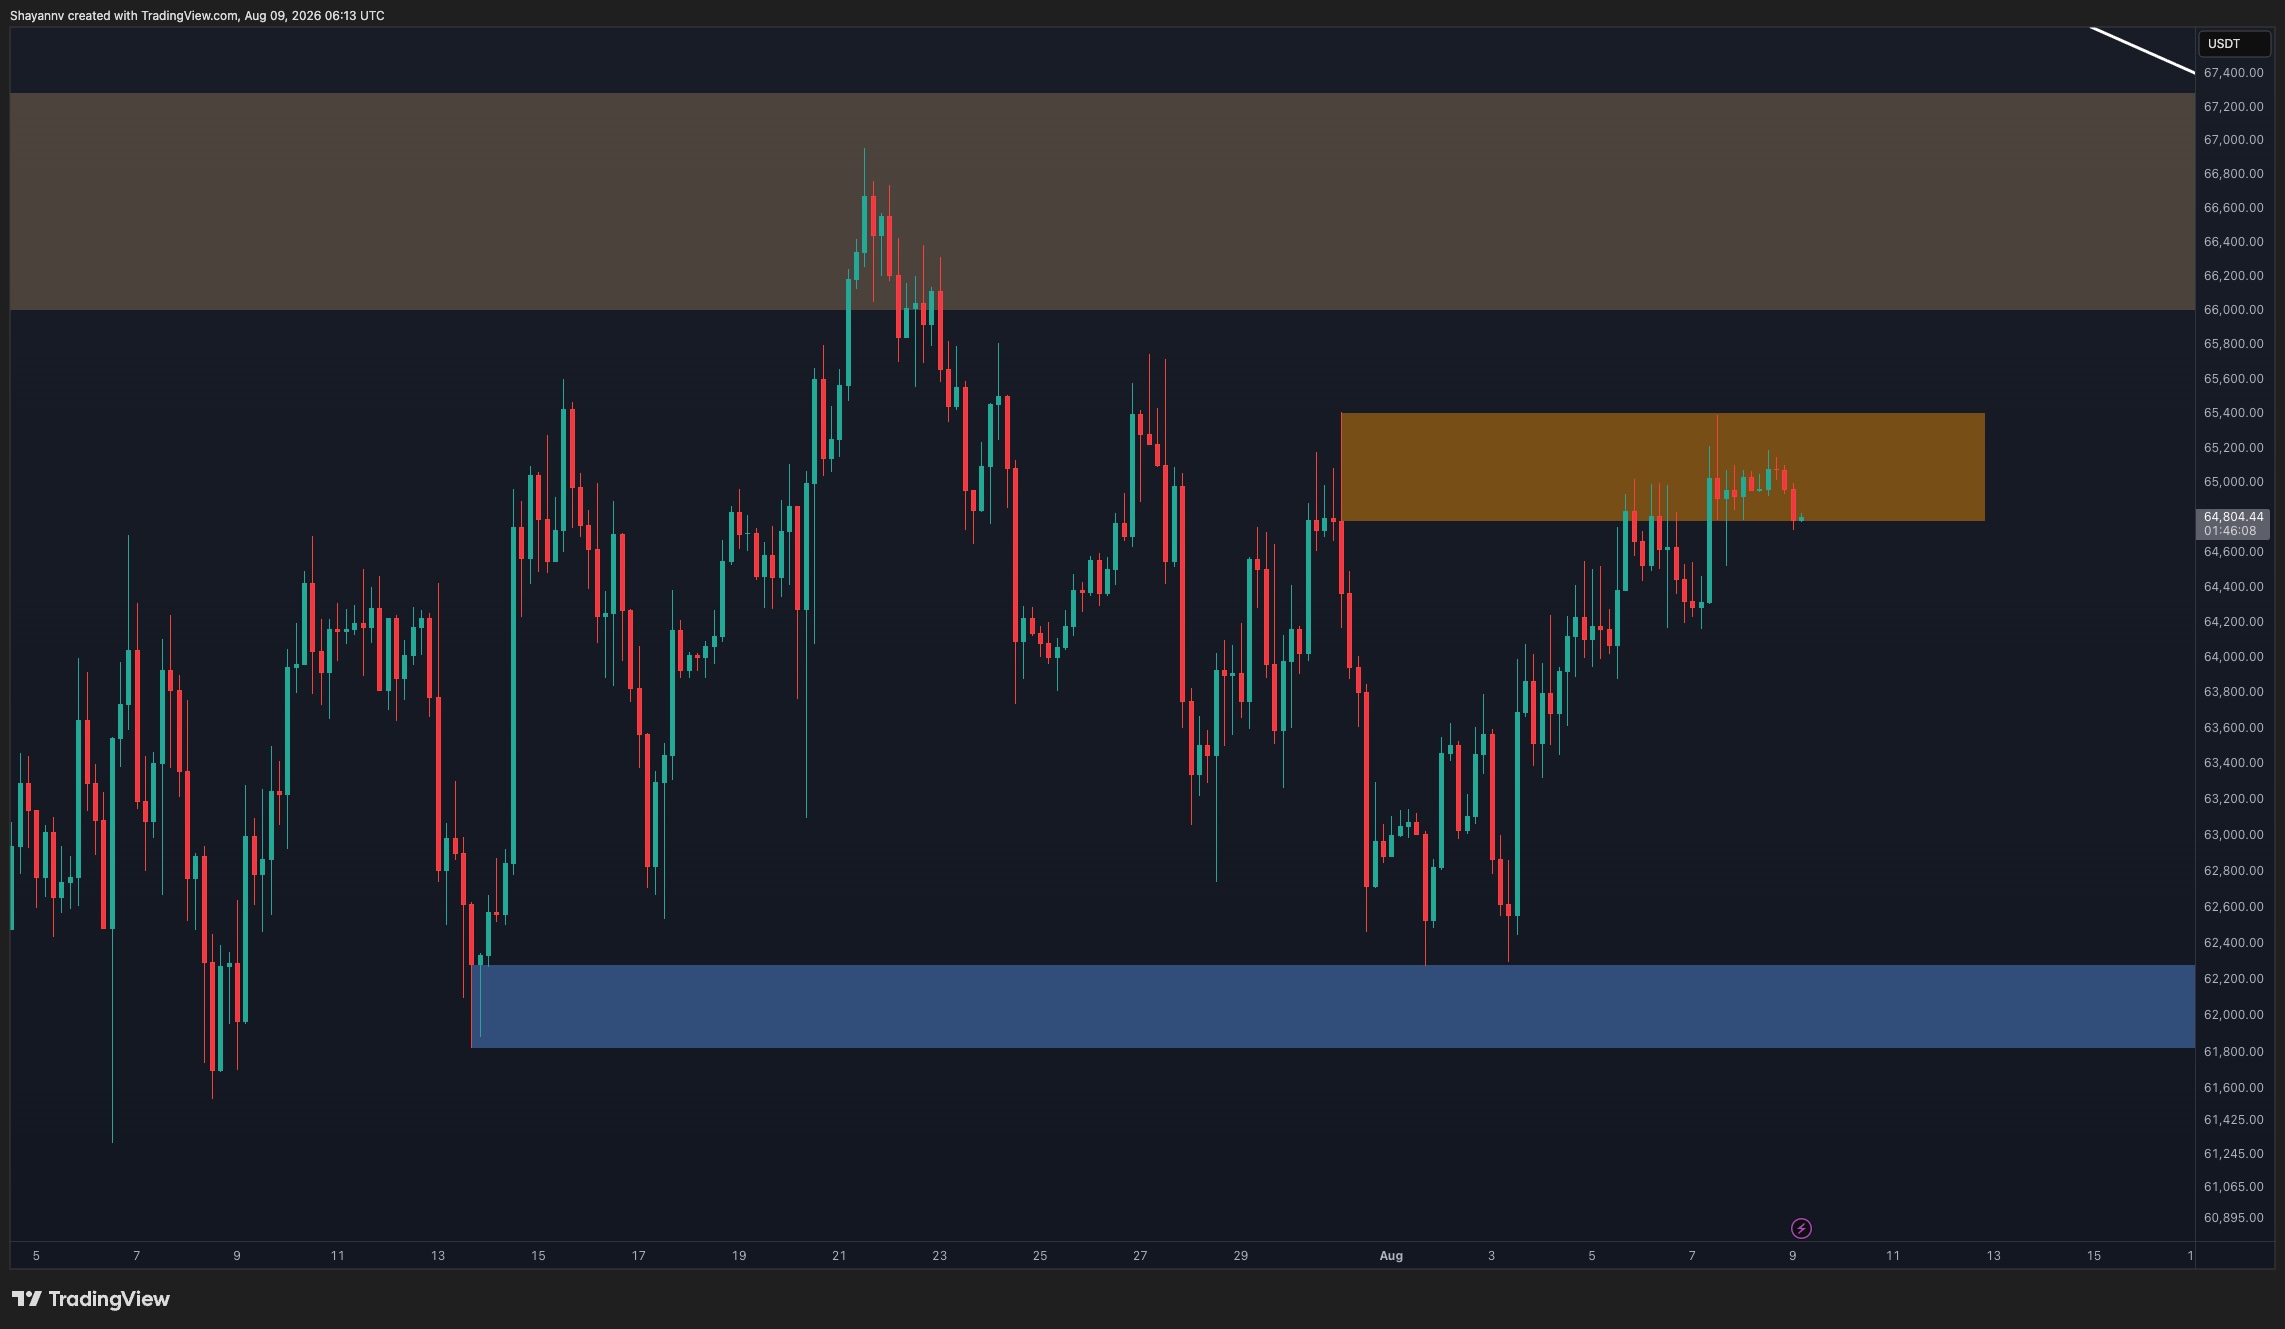
The 4 hour view shows buyer hurdles clearly. BTC climbed from the 61800 to 62300 support area but keeps stalling at the orange supply box near 64800 to 65400. Recent candles cluster at the lower edge of that zone instead of blasting through. Failure to reclaim resistance after the 62000 recovery hints momentum fades near a key line.
Staying below 64800 to 65400 keeps rejection risk alive. Any pullback could unwind gains and retest 61800 to 62300. A firm break and hold above 65400 would ease bearish pressure and open room toward the bigger 65800 to 66800 band.
Onchain Signals 🌑
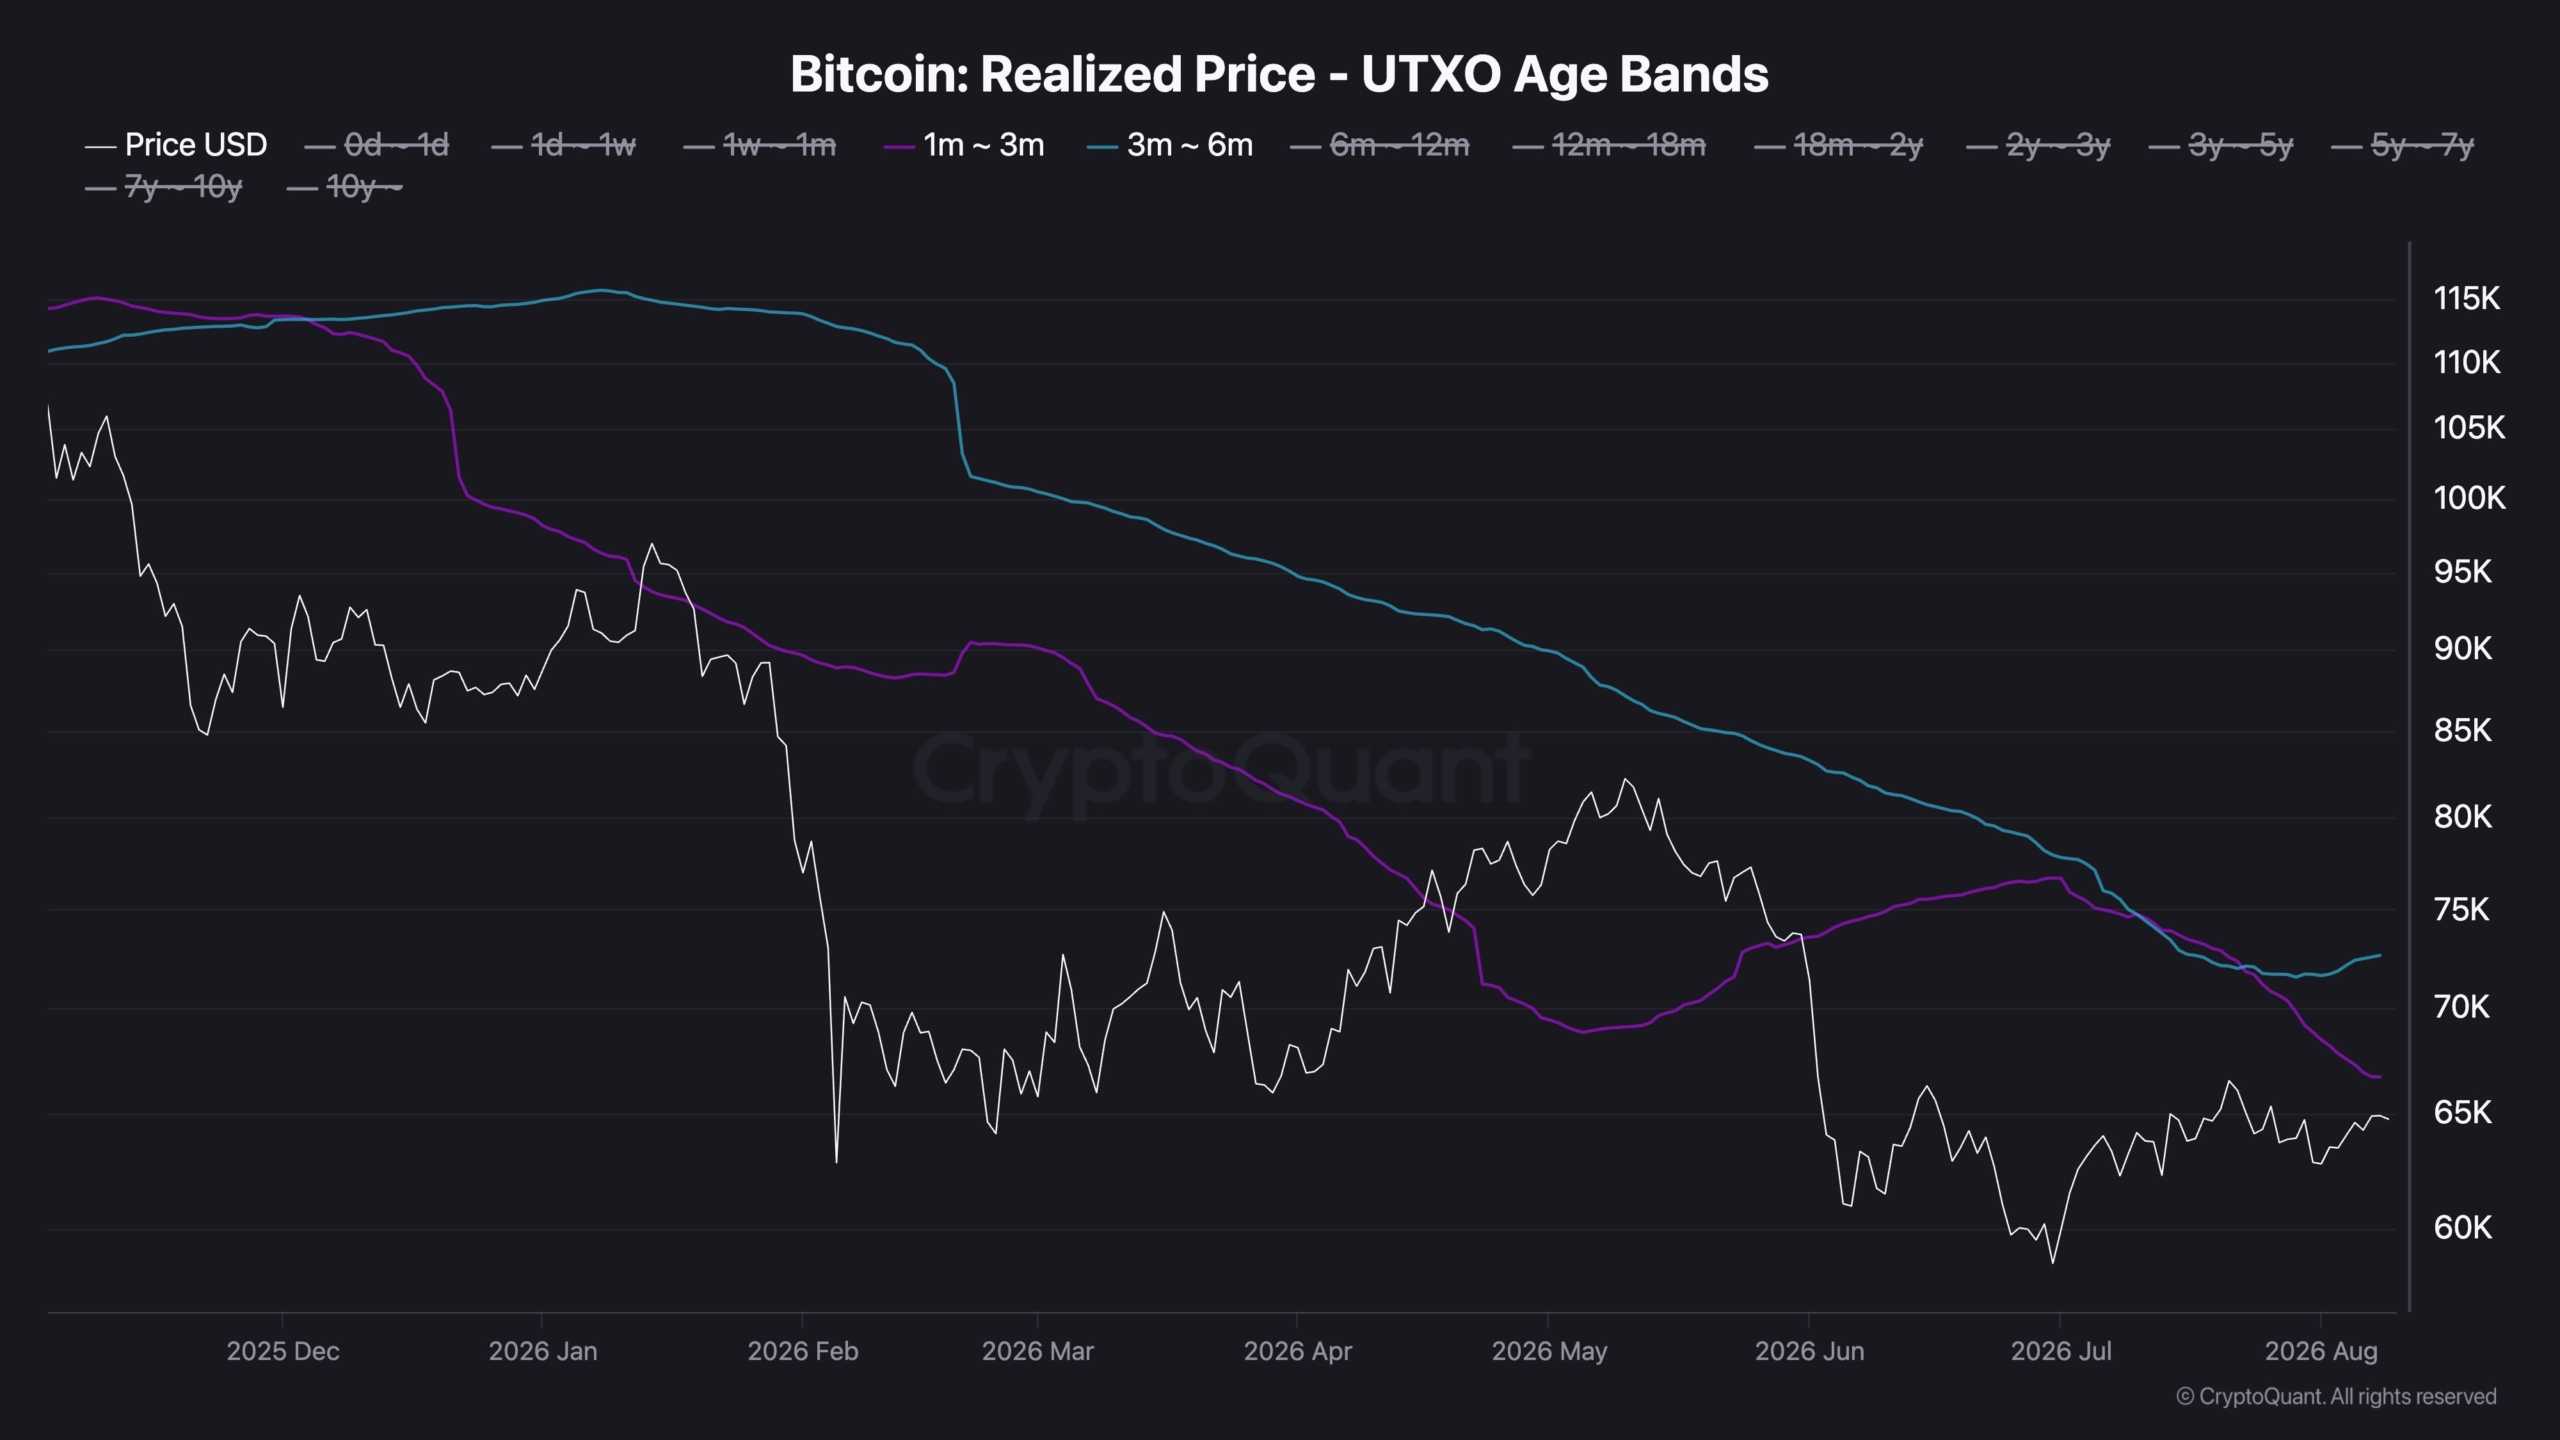
Realized Price UTXO Age Bands add context to current structure. The 1 to 3 month cohort realized price sits near 67000 while the 3 to 6 month group holds around 72000, both above spot. At 65000 both cohorts sit in unrealized loss, forming overhead cost basis that may cap rallies.
The closer 67000 level could act as near term resistance if recent buyers sell into recovery. Reclaiming those bands would show the market absorbing supply and support a stronger rebound narrative. Until then the picture aligns with technical resistance overhead.
Just another echo from the void by iconofsin.eth 💖
