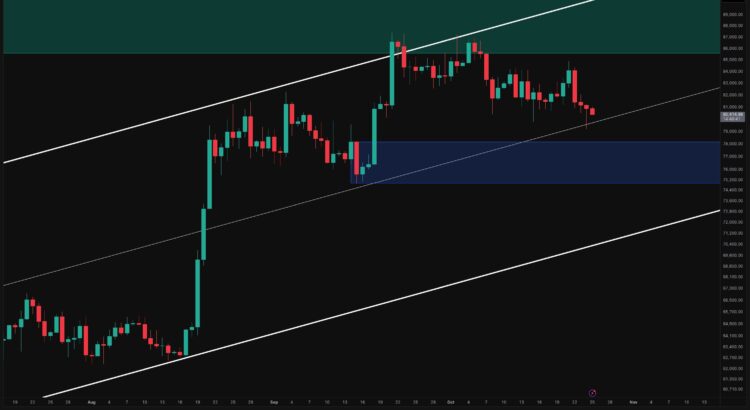
Bitcoin is hovering near 80.5K after its latest rebound failed to hold above resistance. The short-term structure remains bearish with buyers defending the 80K region while substantial liquidation exposure sits below recent lows 💀.
Bitcoin Daily Chart Breakdown 🖤
On the daily timeframe Bitcoin’s recovery toward 84K–85K was followed by a sharp rejection and renewed selling. The subsequent candles have formed lower highs and pushed the price toward the ascending channel’s midpoint around 79.5K–80K. Although a recent lower wick shows buying interest beneath this trendline the rebound has lacked sustained follow-through 👀. Holding the midpoint could allow another recovery attempt but buyers first need to reclaim the 81K–82K area before challenging resistance around 84K–85K. The broader 85.5K–90.5K supply zone remains the main obstacle to restoring the daily bullish trend 📉. Conversely sustained acceptance beneath 79K–80K would weaken the channel’s internal support and favor a deeper correction toward the highlighted 75K–78K demand zone. This region contains the base of September’s advance and represents the next major daily support area 😈.
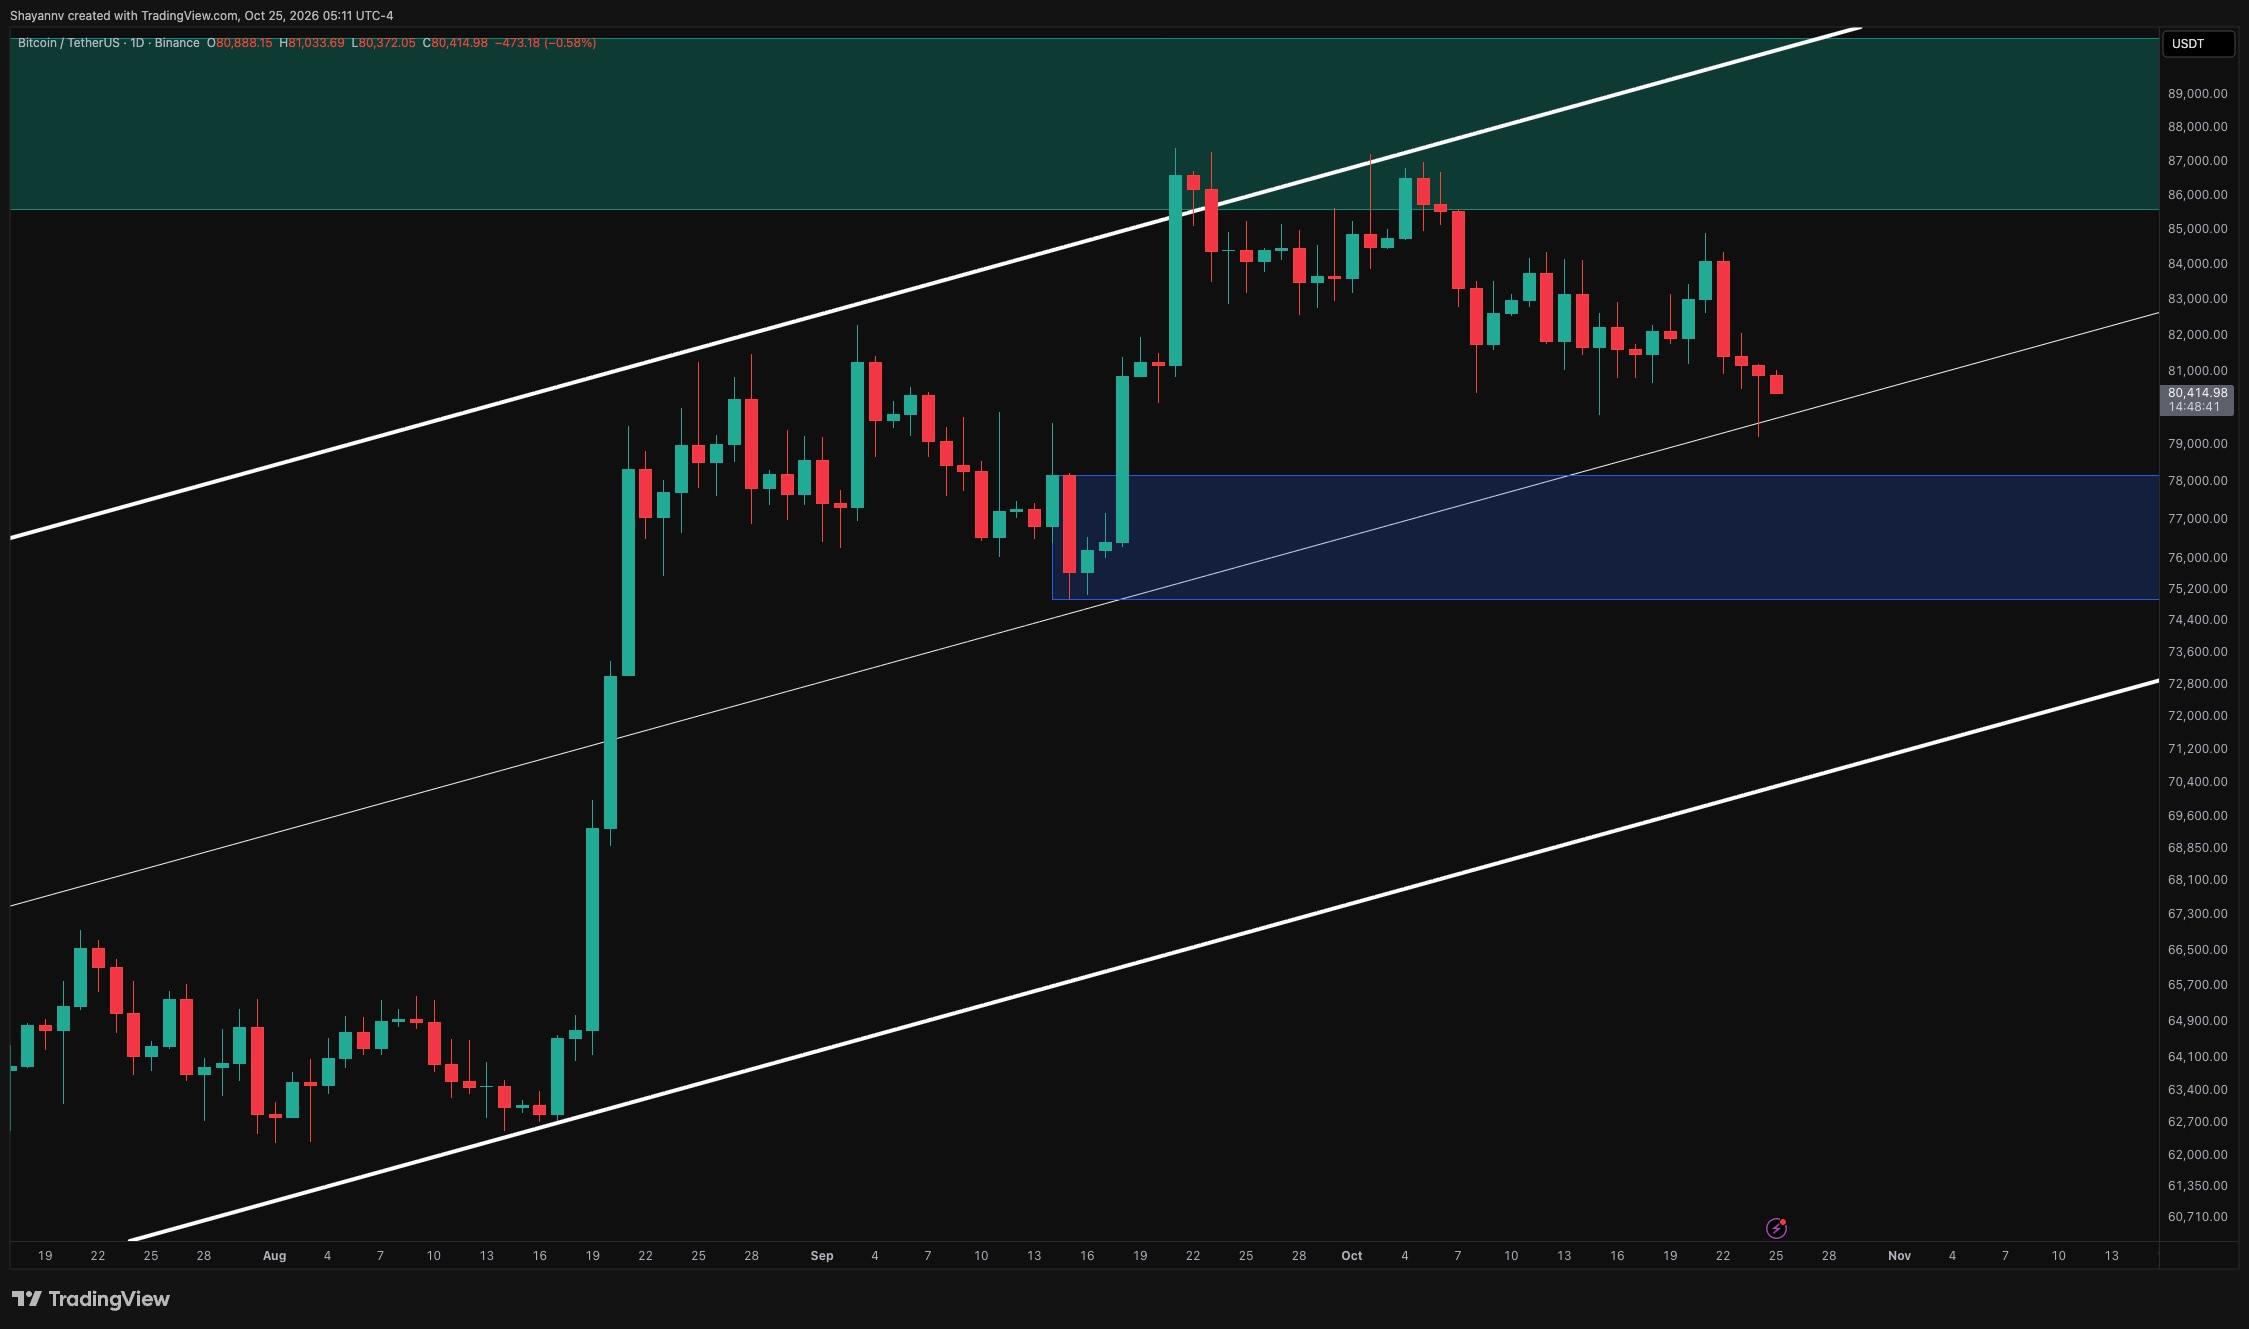
BTC 4H Chart Vibes Analysis 🌑
The 4-hour chart shows Bitcoin breaking below its ascending support trendline after a failed breakout above the 84K–84.4K resistance zone. The brief push toward 84.8K quickly reversed leaving a lower high beneath the broader 86K–87.2K supply area 🕸️. BTC is now trading inside the 80.1K–81.3K demand zone below the broken trendline. A recent sweep toward 79.2K attracted buyers but the recovery stalled around 81K suggesting that sellers continue to restrict rebounds 🔥. The bearish continuation scenario remains favored while Bitcoin stays beneath the 81.2K–81.5K resistance confluence. A decisive loss of 80K followed by a break below 79.2K could extend the decline toward 78K and the deeper 75K–76.3K demand zone. Alternatively reclaiming the trendline and holding above 81.5K would ease immediate pressure and support a recovery toward 82.5K–84K 🐻.
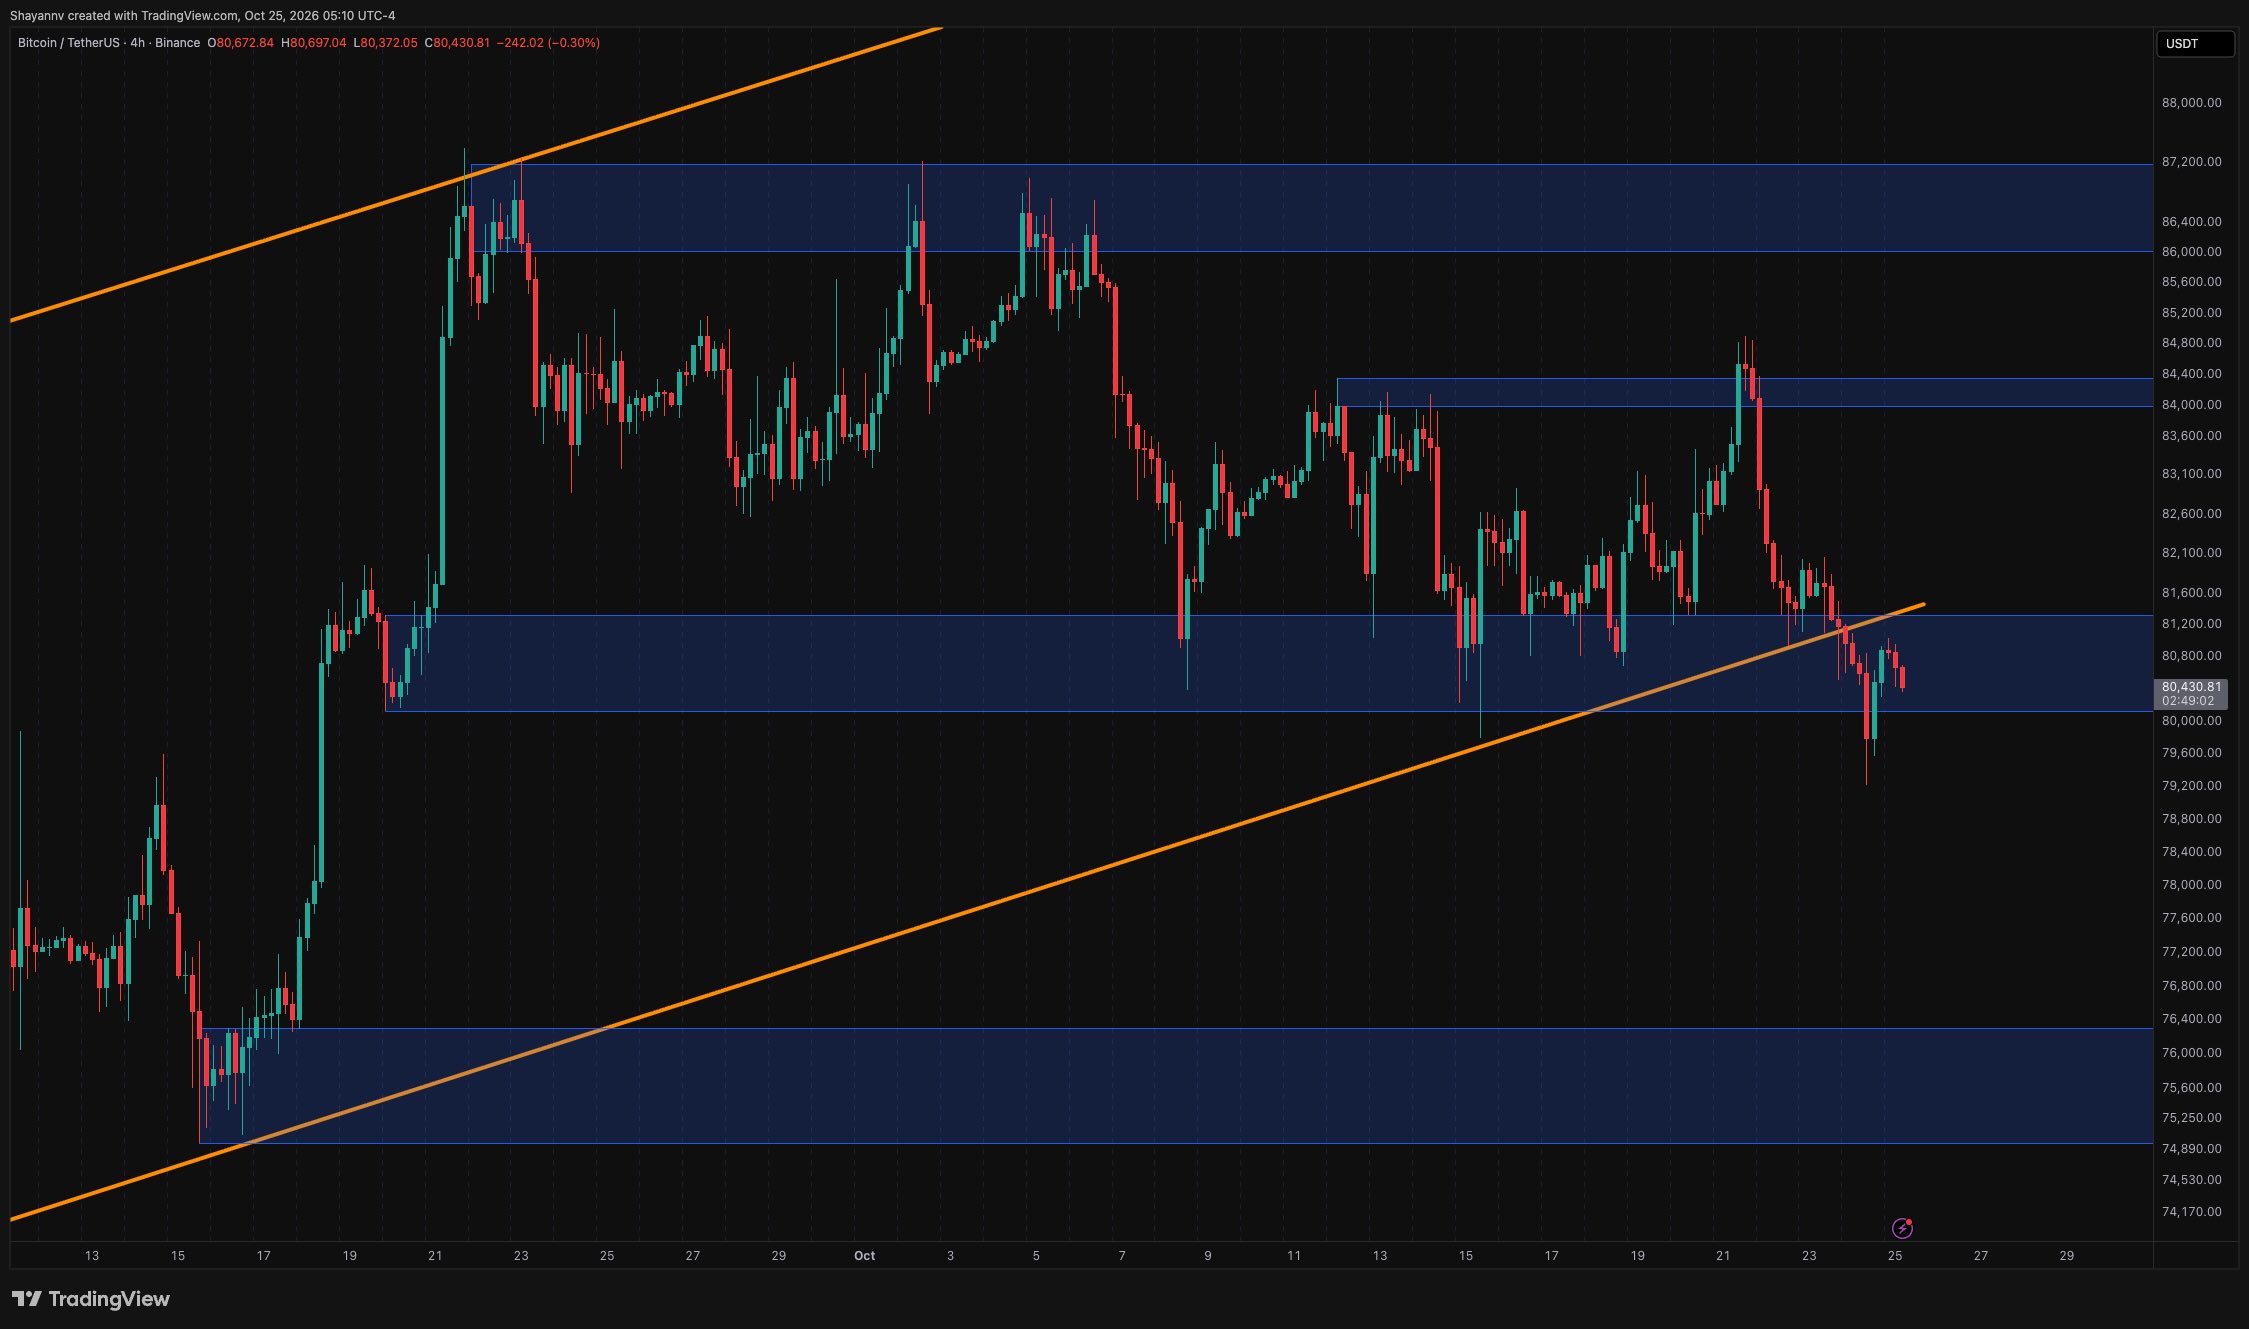
Liquidation Heatmap Tea Time 💸
The two-week Binance BTC/USDT liquidation heatmap highlights a prominent estimated liquidation cluster around 78.5K–79K beneath the recent price lows. Additional concentrations extend toward 77K–78K creating a broader downside liquidity region 😈. This positioning is relevant because Bitcoin’s latest bounce has failed to establish a stronger recovery. If the price loses 80K and breaks the recent 79.2K low long liquidations could amplify selling as BTC approaches the 78.5K–79K cluster. Its proximity to the upper boundary of daily demand near 78K adds significance to that area although liquidation exposure does not guarantee support 🌑. Above price a substantial cluster remains around 85K–85.7K with a nearer band around 82K–82.5K. These could become relevant if buyers reclaim the broken short-term structure. For now weak rebounds and the nearby downside concentration keep the risk of another liquidity sweep below recent lows in focus 🖤.
Just another echo from the void by iconofsin.eth 💖
