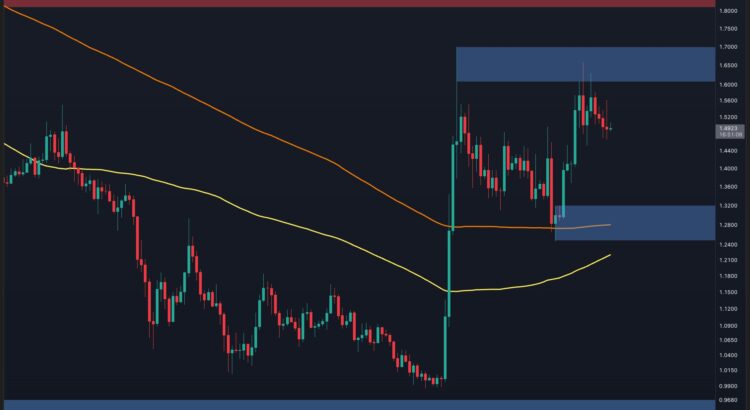
XRP is holding strong above $1.50 after getting pushed back from that major resistance zone. 🦇 The bigger recovery still feels solid rn tho the lower highs mean buyers gotta protect some key spots before pushing higher.
XRP Price Analysis The Daily Chart 🌑
On the daily chart this asset bounced hard out of the $1.25–$1.32 support zone and ran right into the $1.61–$1.70 resistance. ✨ That long upper wick plus the follow up bearish candles show sellers were stacked deep at this level so price slid back toward $1.53.
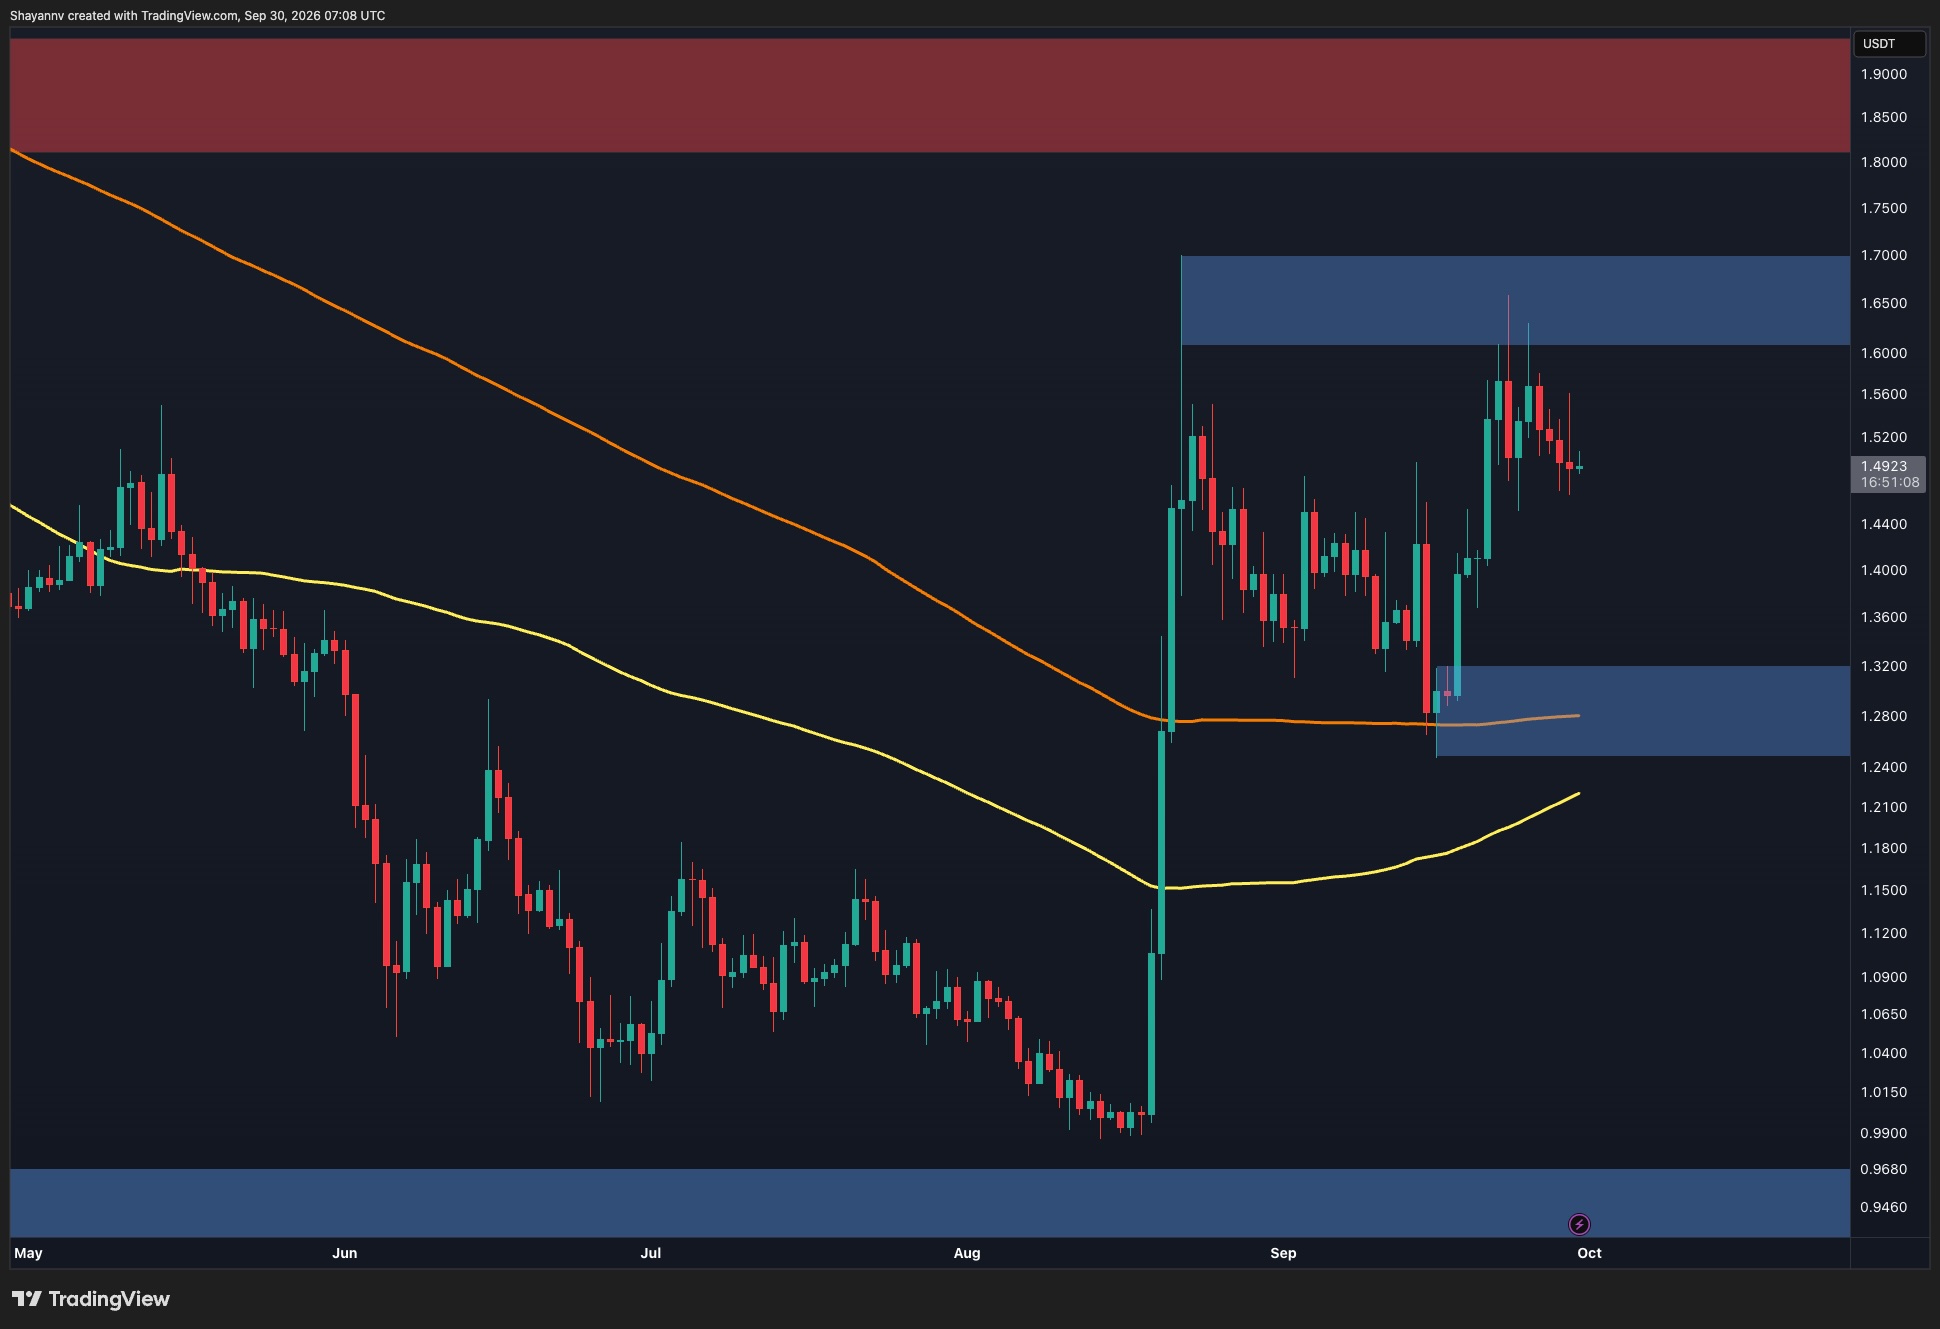
Despite the dip XRP stays above both moving averages. 💀 The orange one flattened near $1.28 while the yellow climbs toward $1.22 so the old downtrend lost steam. Still no clean bullish crossover happened yet and this rejection proves a real breakout is not locked in.
XRP USDT 4 Hour Chart 🕸️
The 4 hour view shows bullish momentum fading fast. 👁️ After tagging the $1.61–$1.70 supply area price keeps printing lower highs and rebounds keep failing above $1.52–$1.55. Right now it is consolidating near $1.52 just over the recent lows around $1.47.
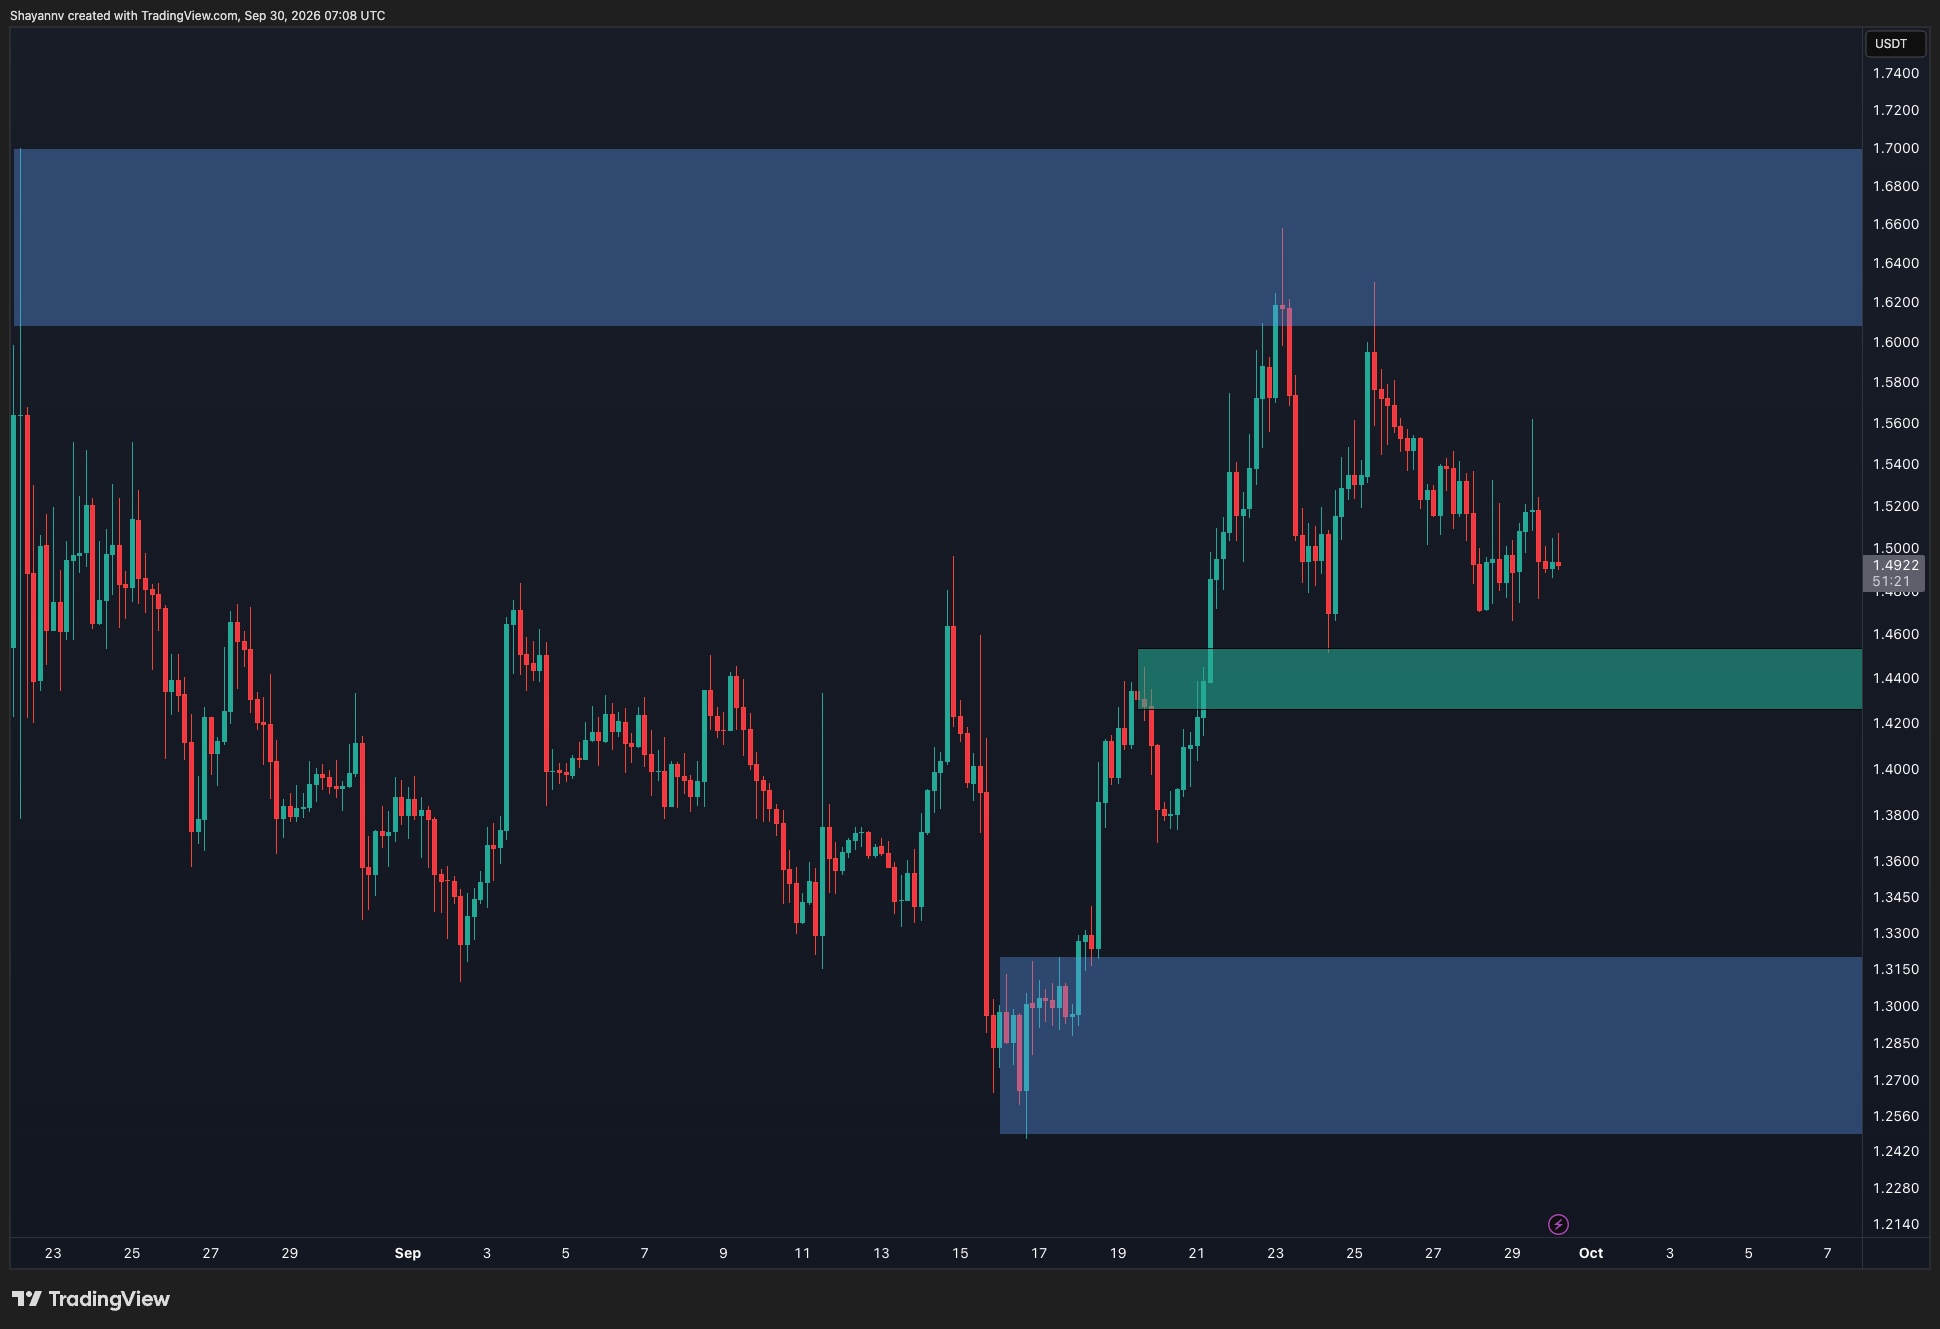
If sellers crack below those lows the $1.43–$1.45 demand zone becomes the next big support spot. 🔮 This area sits right at the base of the prior bullish move and could spark fresh buying. A clean break lower would weaken the whole recovery and open doors toward $1.38 then the wider $1.25–$1.32 demand zone.
For buyers to flip control XRP must reclaim the $1.52–$1.55 resistance and break the lower high streak. 🖤 That kind of move could fuel another run at $1.60–$1.62 but real acceptance above the full $1.61–$1.70 zone is needed to lock in the bullish vibe.
Just another echo from the void by iconofsin.eth 💖
