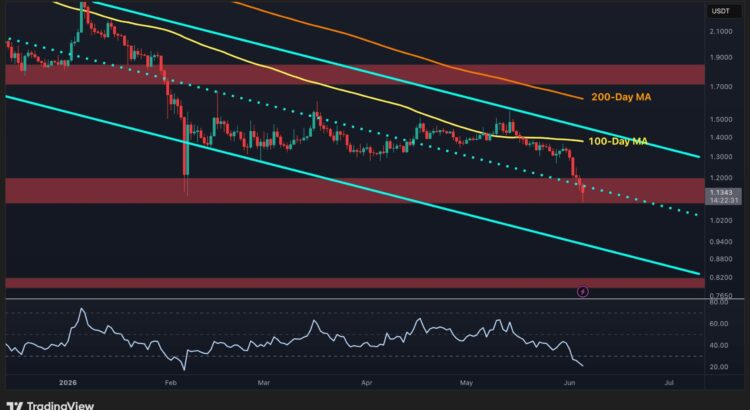
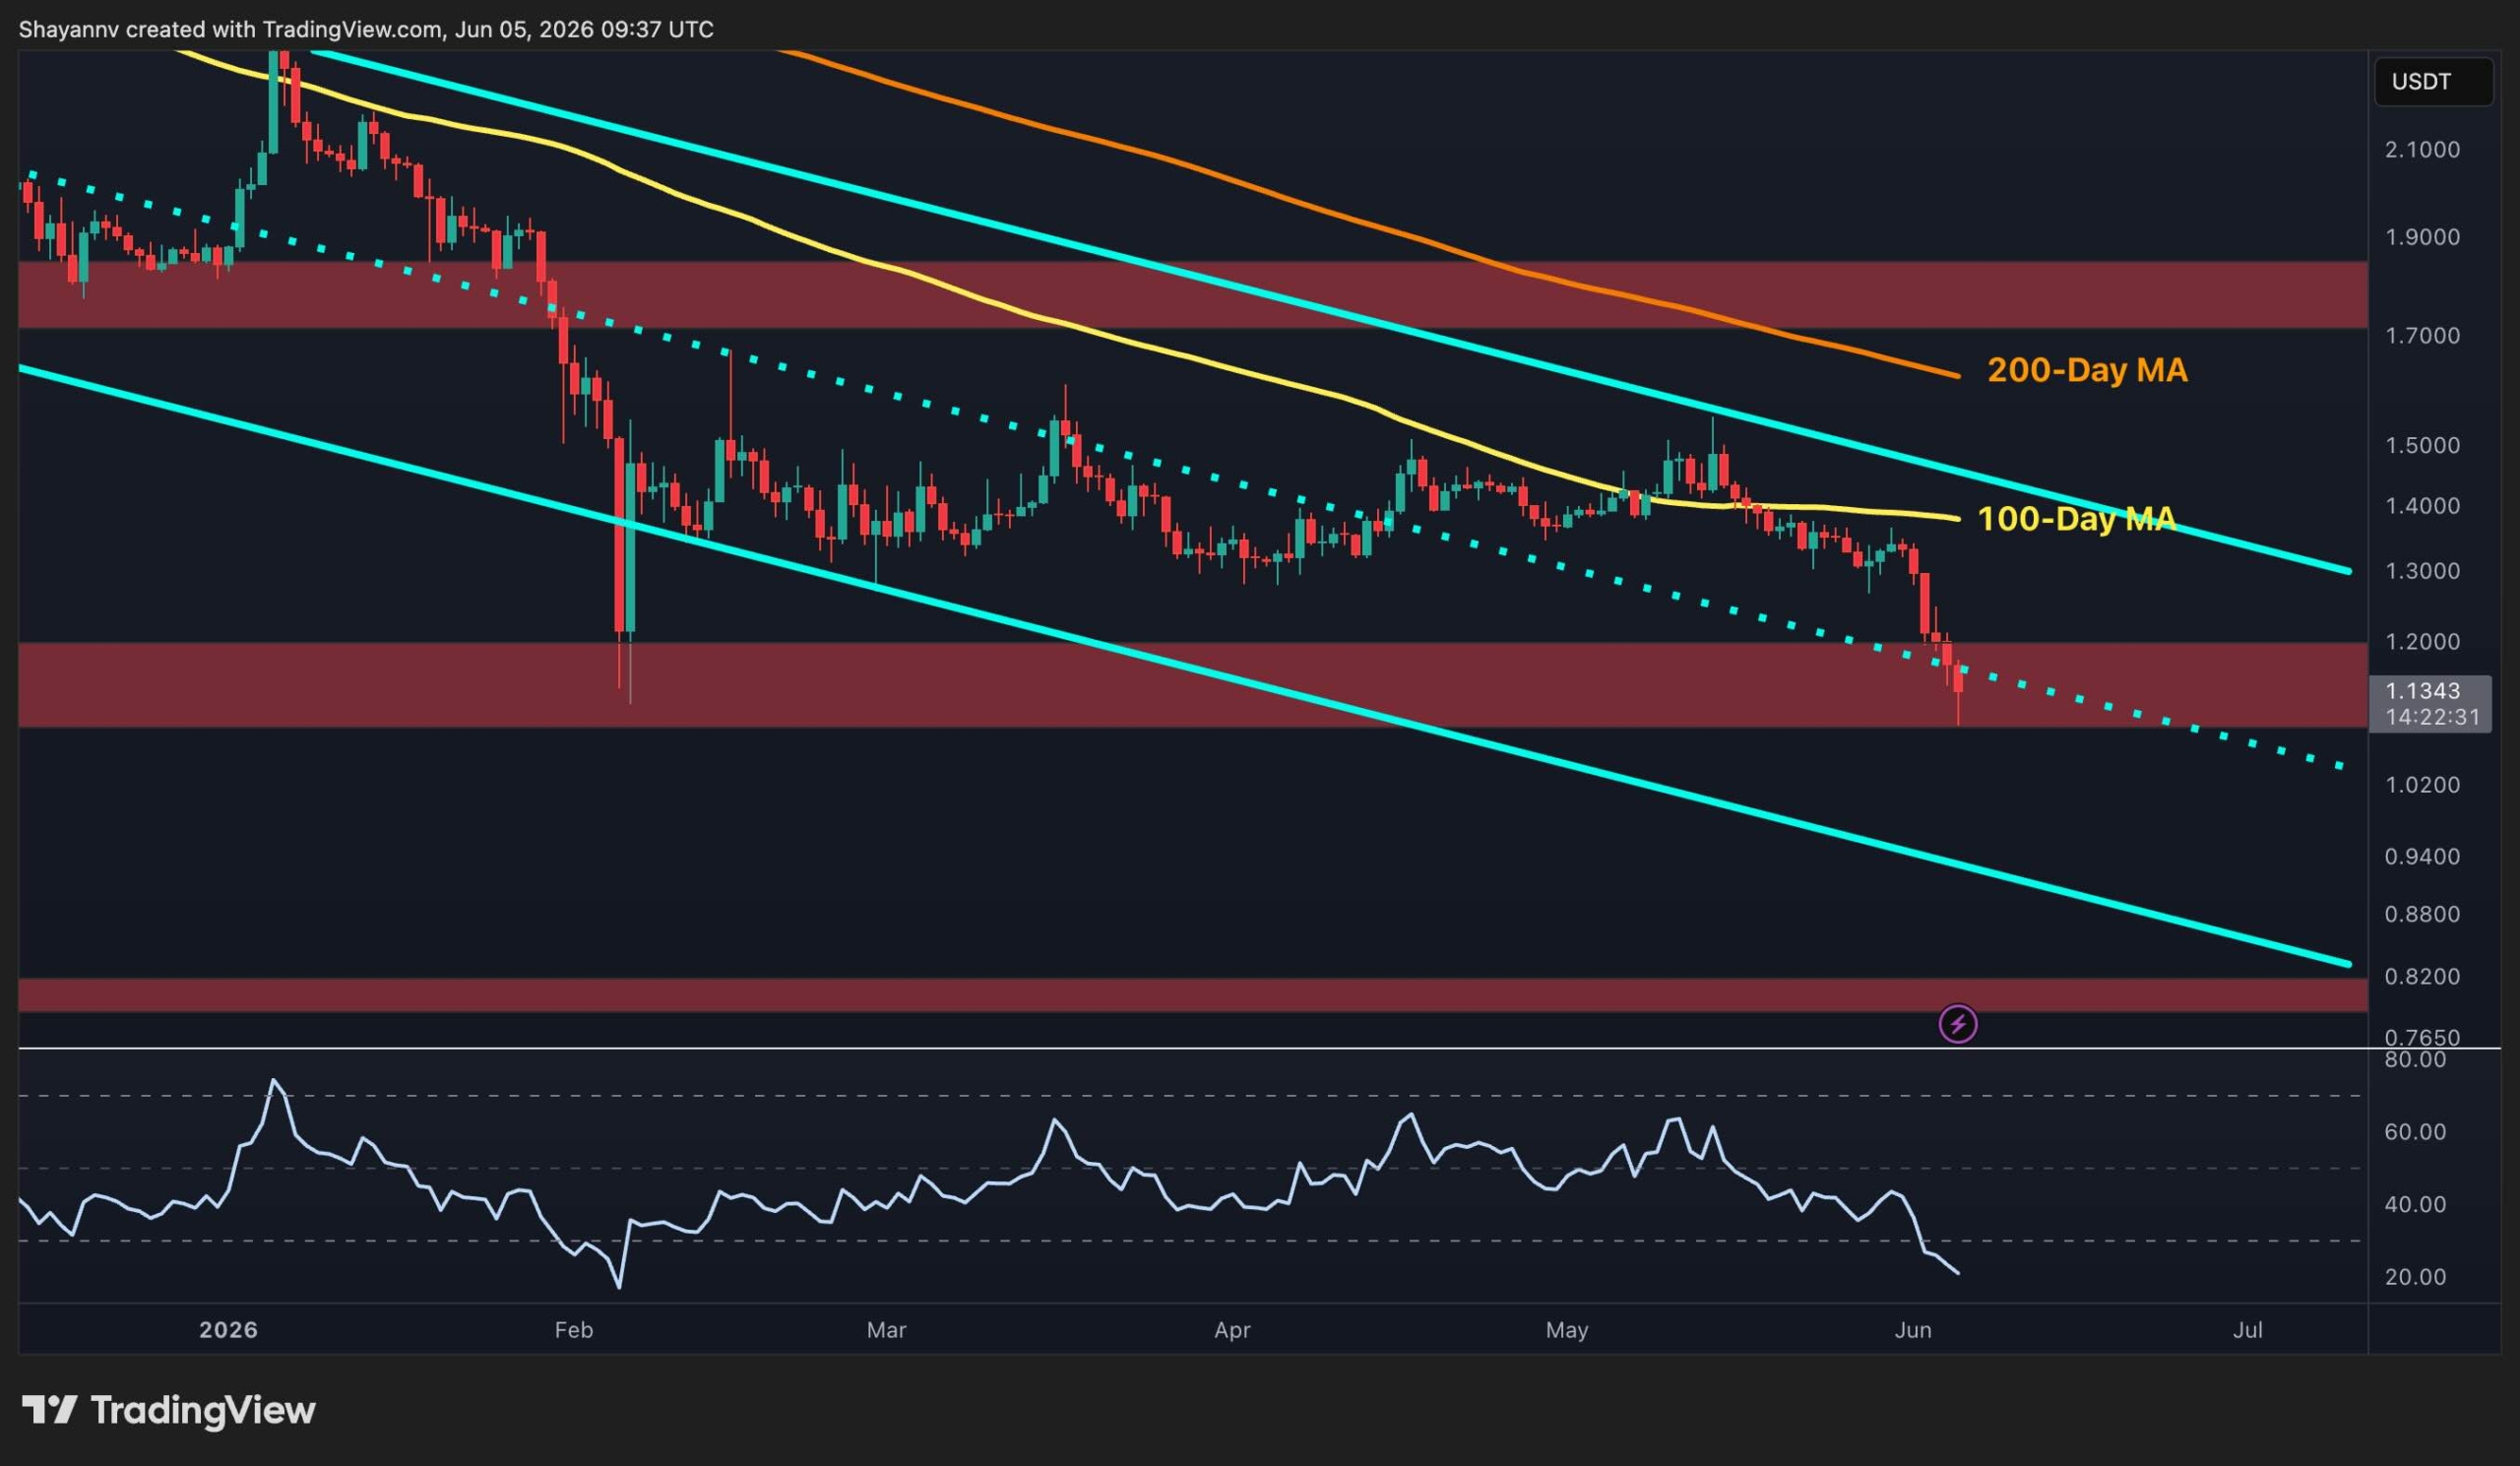
XRP kicks off June with its biggest slide in three months 🖤 price just cracked the $1.20 floor that held for ages and now sits at $1.11. RSI just hit its weakest print since Feb’s total meltdown and the next real support waits almost $0.30 lower. This isn’t some normal dip from resistance—it feels like the final barrier giving way 🌑
Ripple Price Analysis: The USDT Pair
On the USDT chart that $1.20 zone which stayed rock solid through Feb’s crash is finally breaking. RSI has plunged to around 20–25, flirting with the same oversold depths from the capitulation low. Those levels usually spark at least a quick relief bounce inside a bigger downtrend even if it doesn’t flip the trend.
Still an oversold RSI alone won’t magically create a floor. $1.20 probably flips into resistance now and any bounce needs a sustained close back above it to confirm reversal instead of just a pause.
Under current price the next key spot is the $0.80 demand area where it lines up with the descending channel’s lower edge. That’s decent confluence but still way lower. Both the 100-day MA at $1.35 and 200-day at $1.60 sit heavy overhead leaving XRP stacked resistance above and almost no structure below on the USDT chart.
The BTC Pair
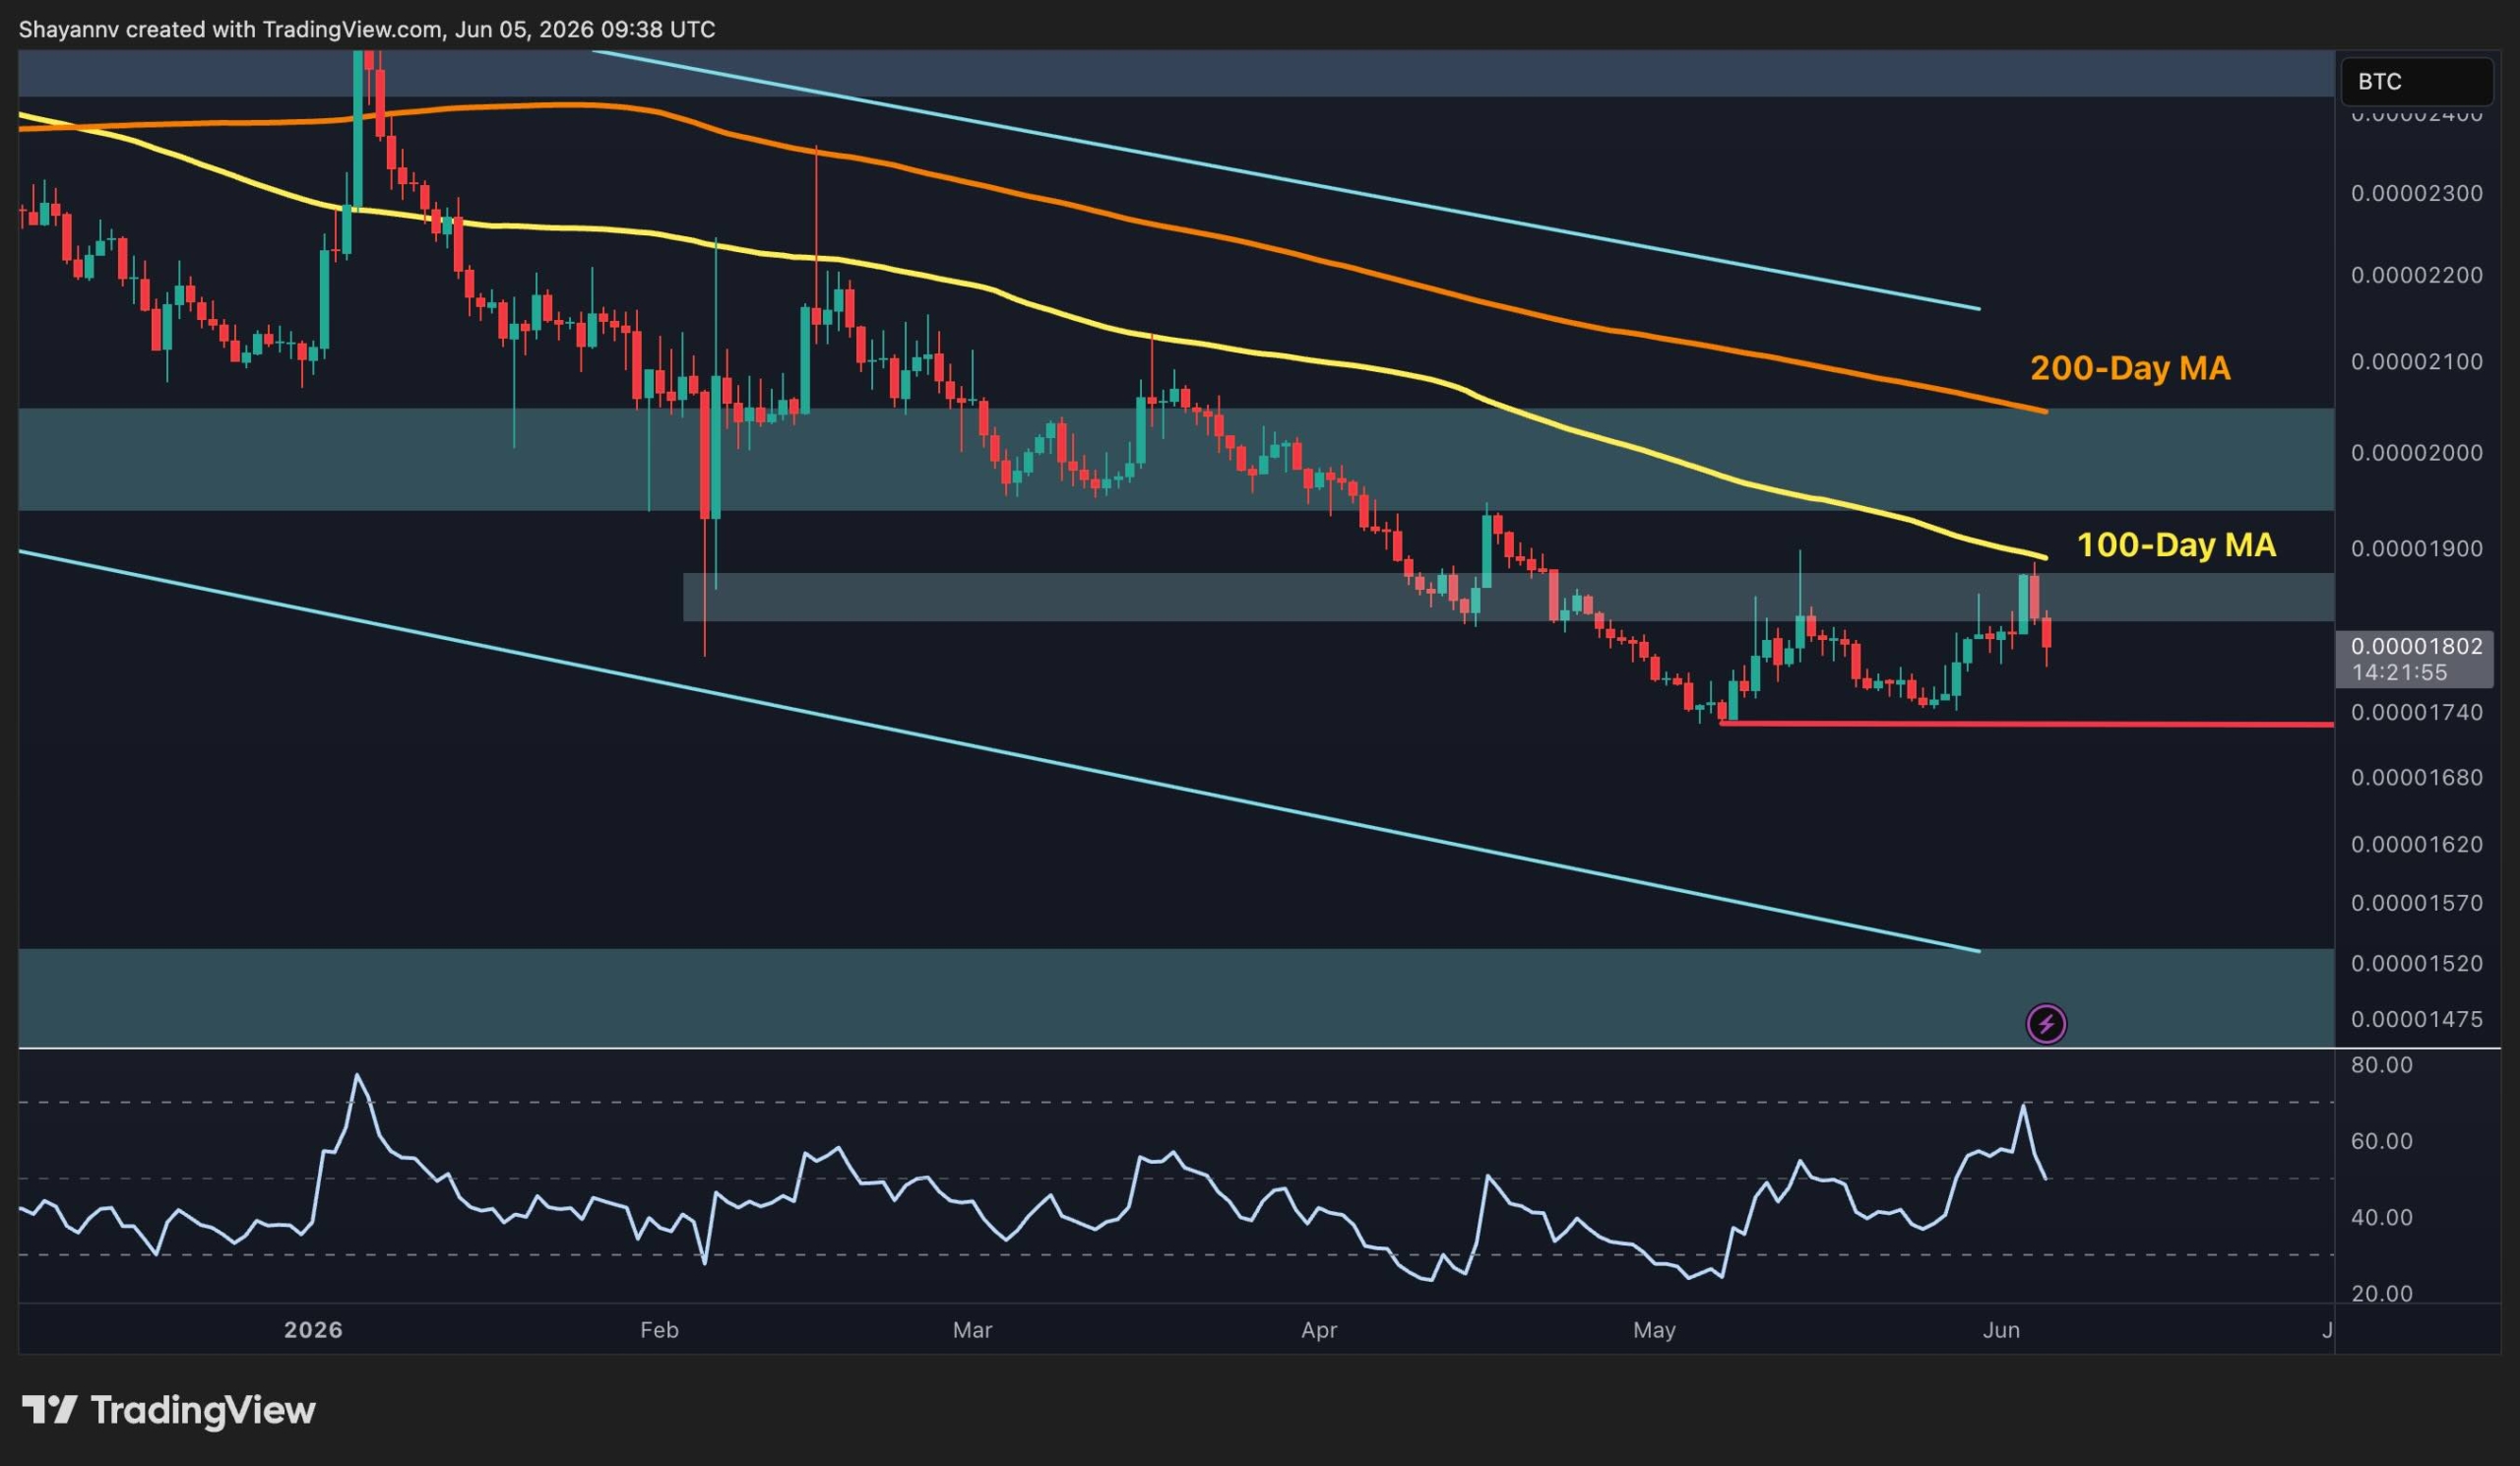
The BTC pair shows more grit. XRP/BTC sits at 1800 sats holding above the recent lows near 1740 sats. RSI spiked to 70 at the end of May hinting at real momentum then faded straight back to 50 so that strength didn’t stick.
Price lingers below the 1850 sat short-term resistance after another rejection there while the falling 100-day MA near 1900 sats acts as immediate overhead pressure. Holding here while the USDT pair broke suggests the dollar weakness is more about broad altcoin selling than any XRP-specific problem versus Bitcoin.
A confirmed close under 1740 sats on the BTC pair especially if USDT weakness continues would signal true breakdowns on both charts at once and opens the 1500 sats zone as the next level to watch.
Just another echo from the void by iconofsin.eth 💖