Bitcoin’s been clawing its way back toward 86k after buyers held that 80k short term demand zone tight once more, with btc chilling near 85k right now. Markets are pricing in around a 25 percent shot at another fed hike late october after the september bump. Meanwhile the nvm ratio just hit its highest since early 2026, which kinda screams that btc might be overvalued versus real network activity 🖤.
Daily Chart Tea Time 📈
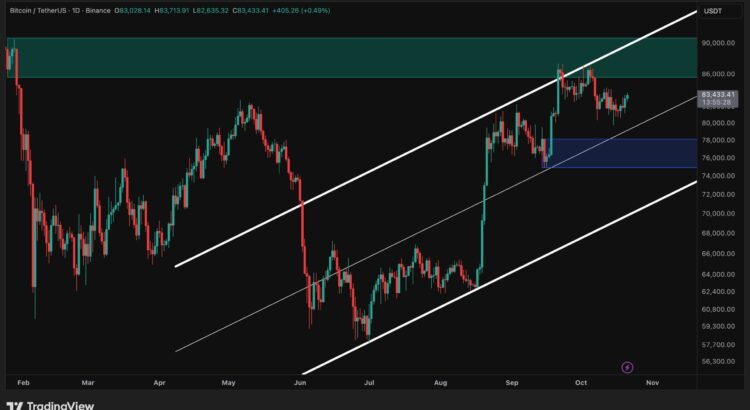
Btc stays locked inside the ascending channel that shaped the comeback from those late june lows near 58k. The rally shoved price right into the 86k to 90k supply zone where february’s sell off kicked off. Two tries at breaking through only left wicks up to 87k before rejection hit hard.
The setup looks solid as long as bitcoin holds above the channel midpoint near 80k. A clean daily close above 86k would slice into the supply zone and clear a path toward 90k.
Losing that midline tho would swing focus down to the 75k to 78k weekly order block that anchored september’s rally. Under that the lower channel edge near 72k becomes the last support before the whole recovery channel breaks 💀.
4 Hour Chart Drama 🌑
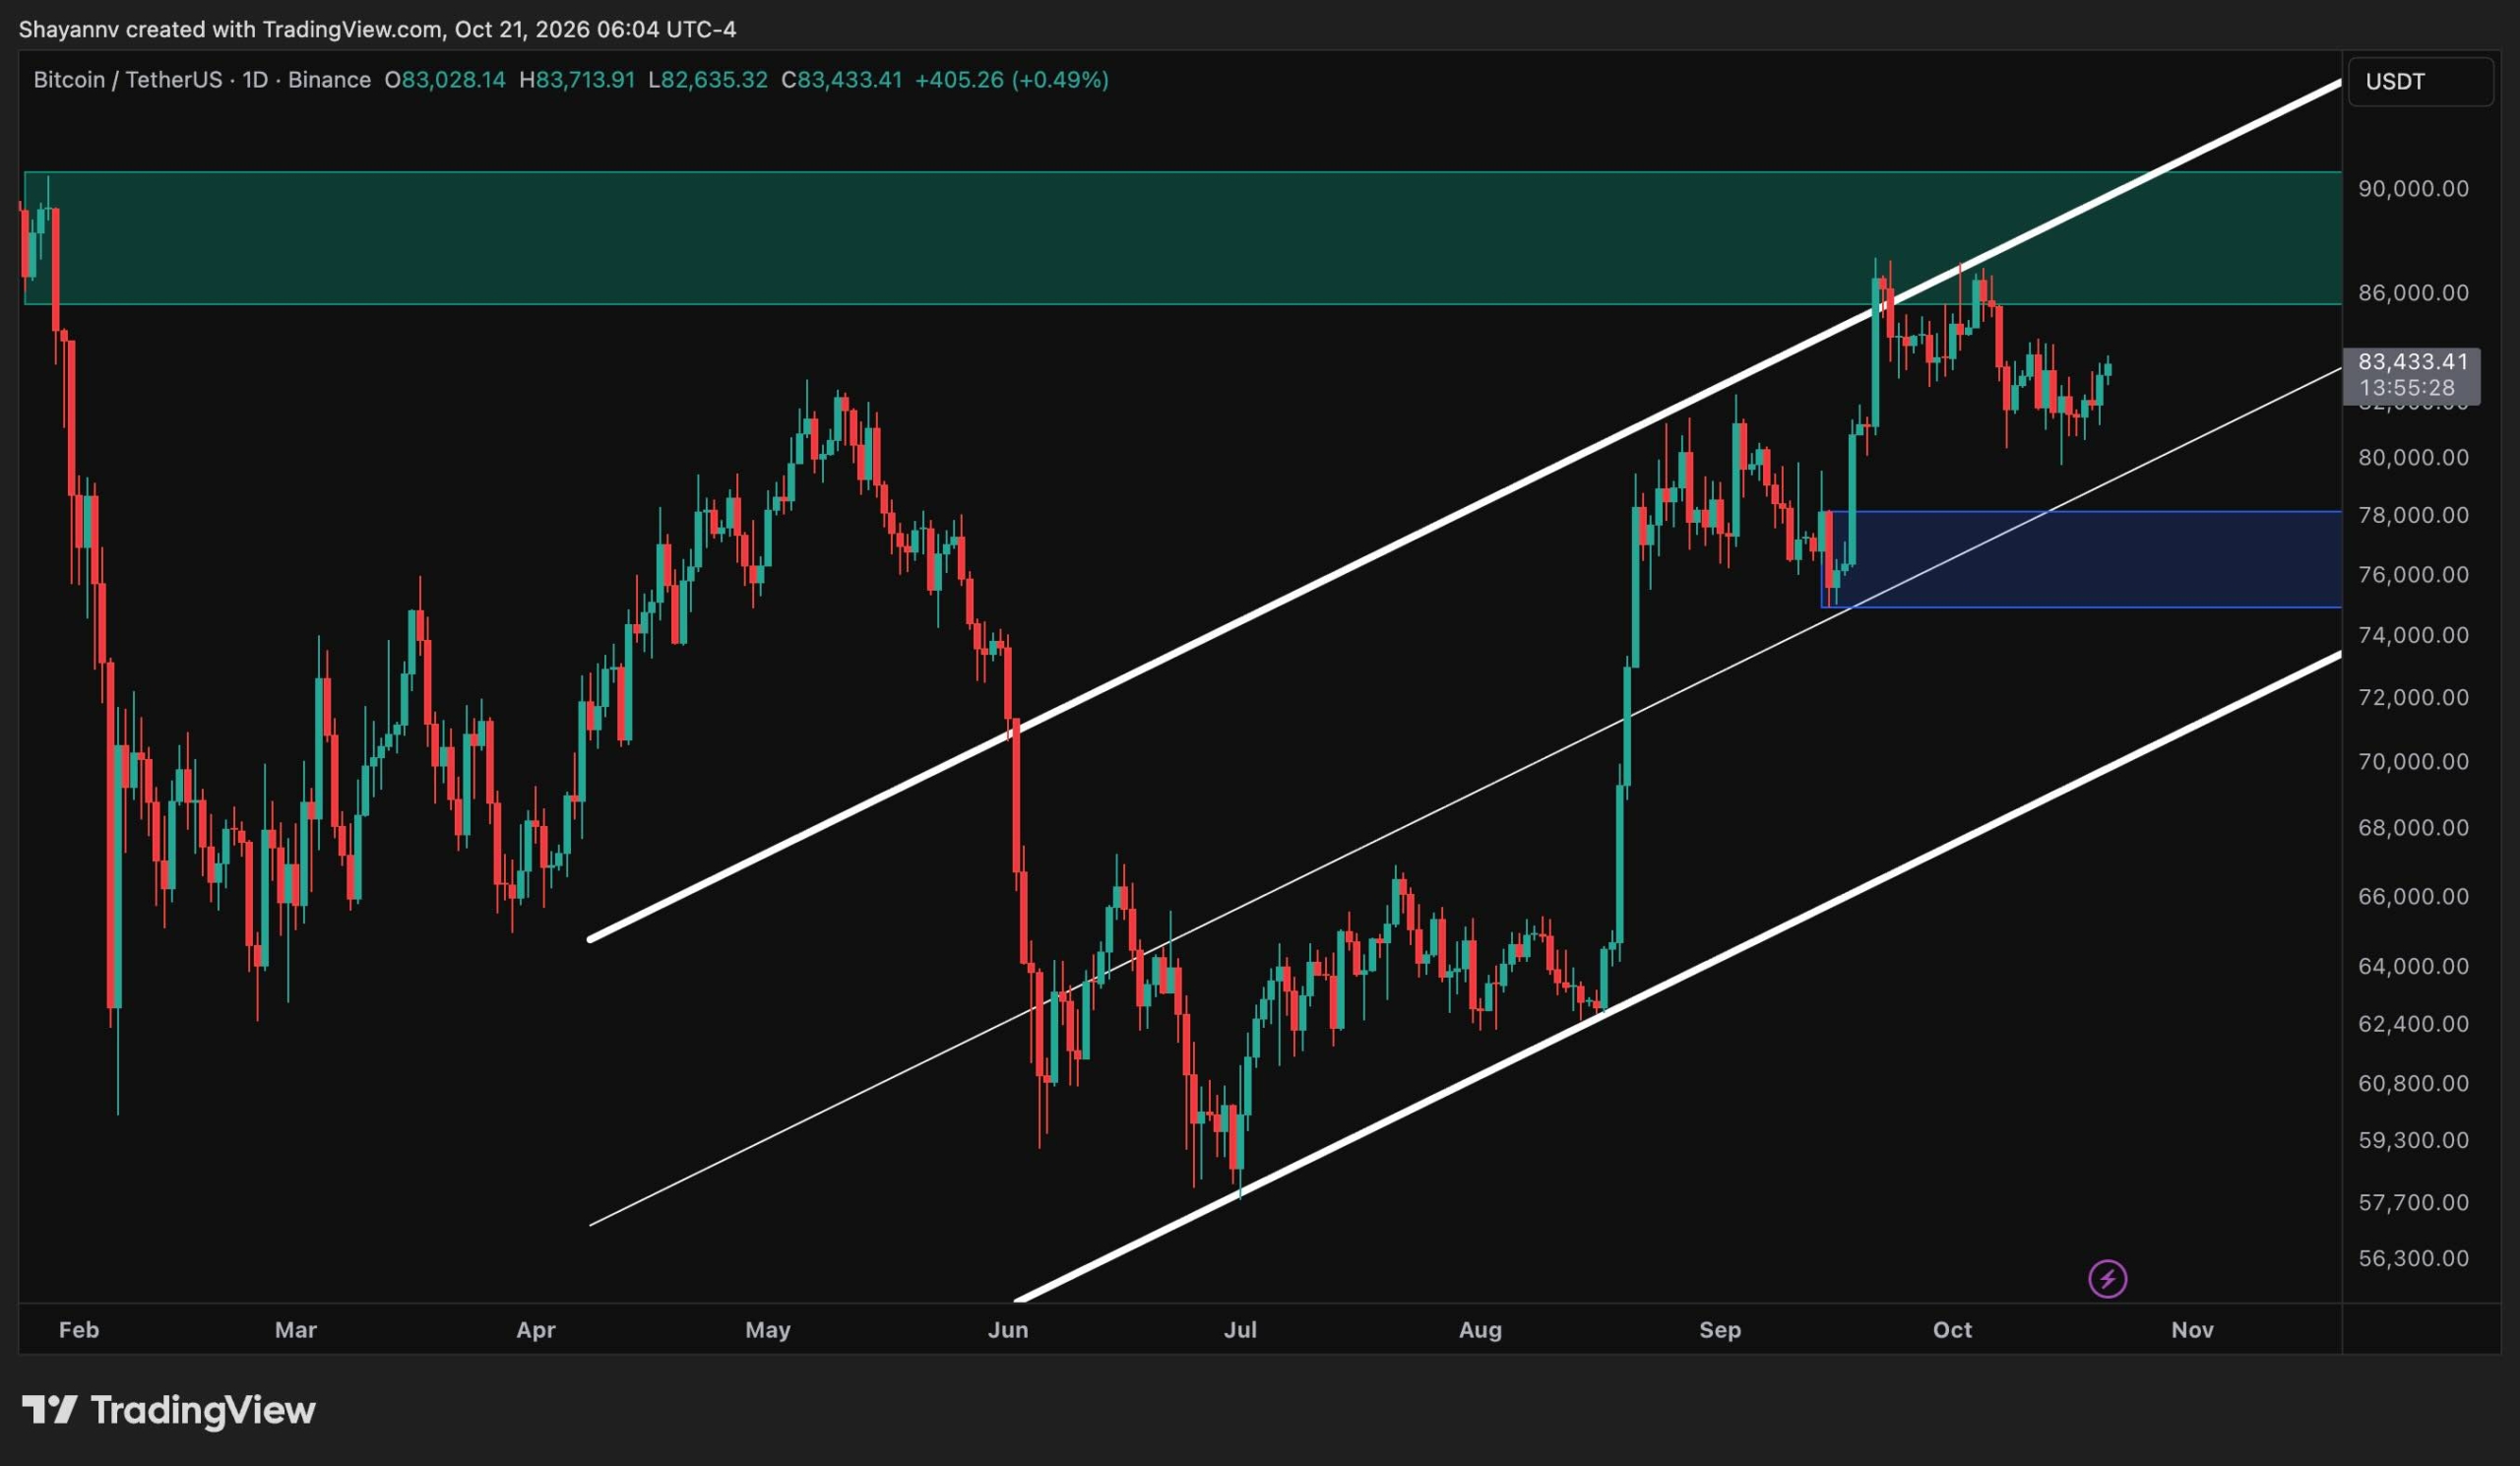
The 4 hour view shows bitcoin riding a rising short term channel since the mid september low near 75k. After the october 6 rejection from 86k price started making lower highs yet every dip got soaked up by the 80k demand zone now lining up with the channel’s lower trendline.
Btc is pressing right against the 84k to 84.3k supply zone from the october 12 lower high. A clean break above it would kill the short term lower high sequence and pull the 85.6k to 86.6k zone into play 😈.
A rejection at 84k would probably send price back toward that same 80k demand spot. Losing both the zone and the trendline would expose the 75k area still the higher low on this timeframe leaves room for a push above 84k 🔮.
On Chain Ratio Check 💸
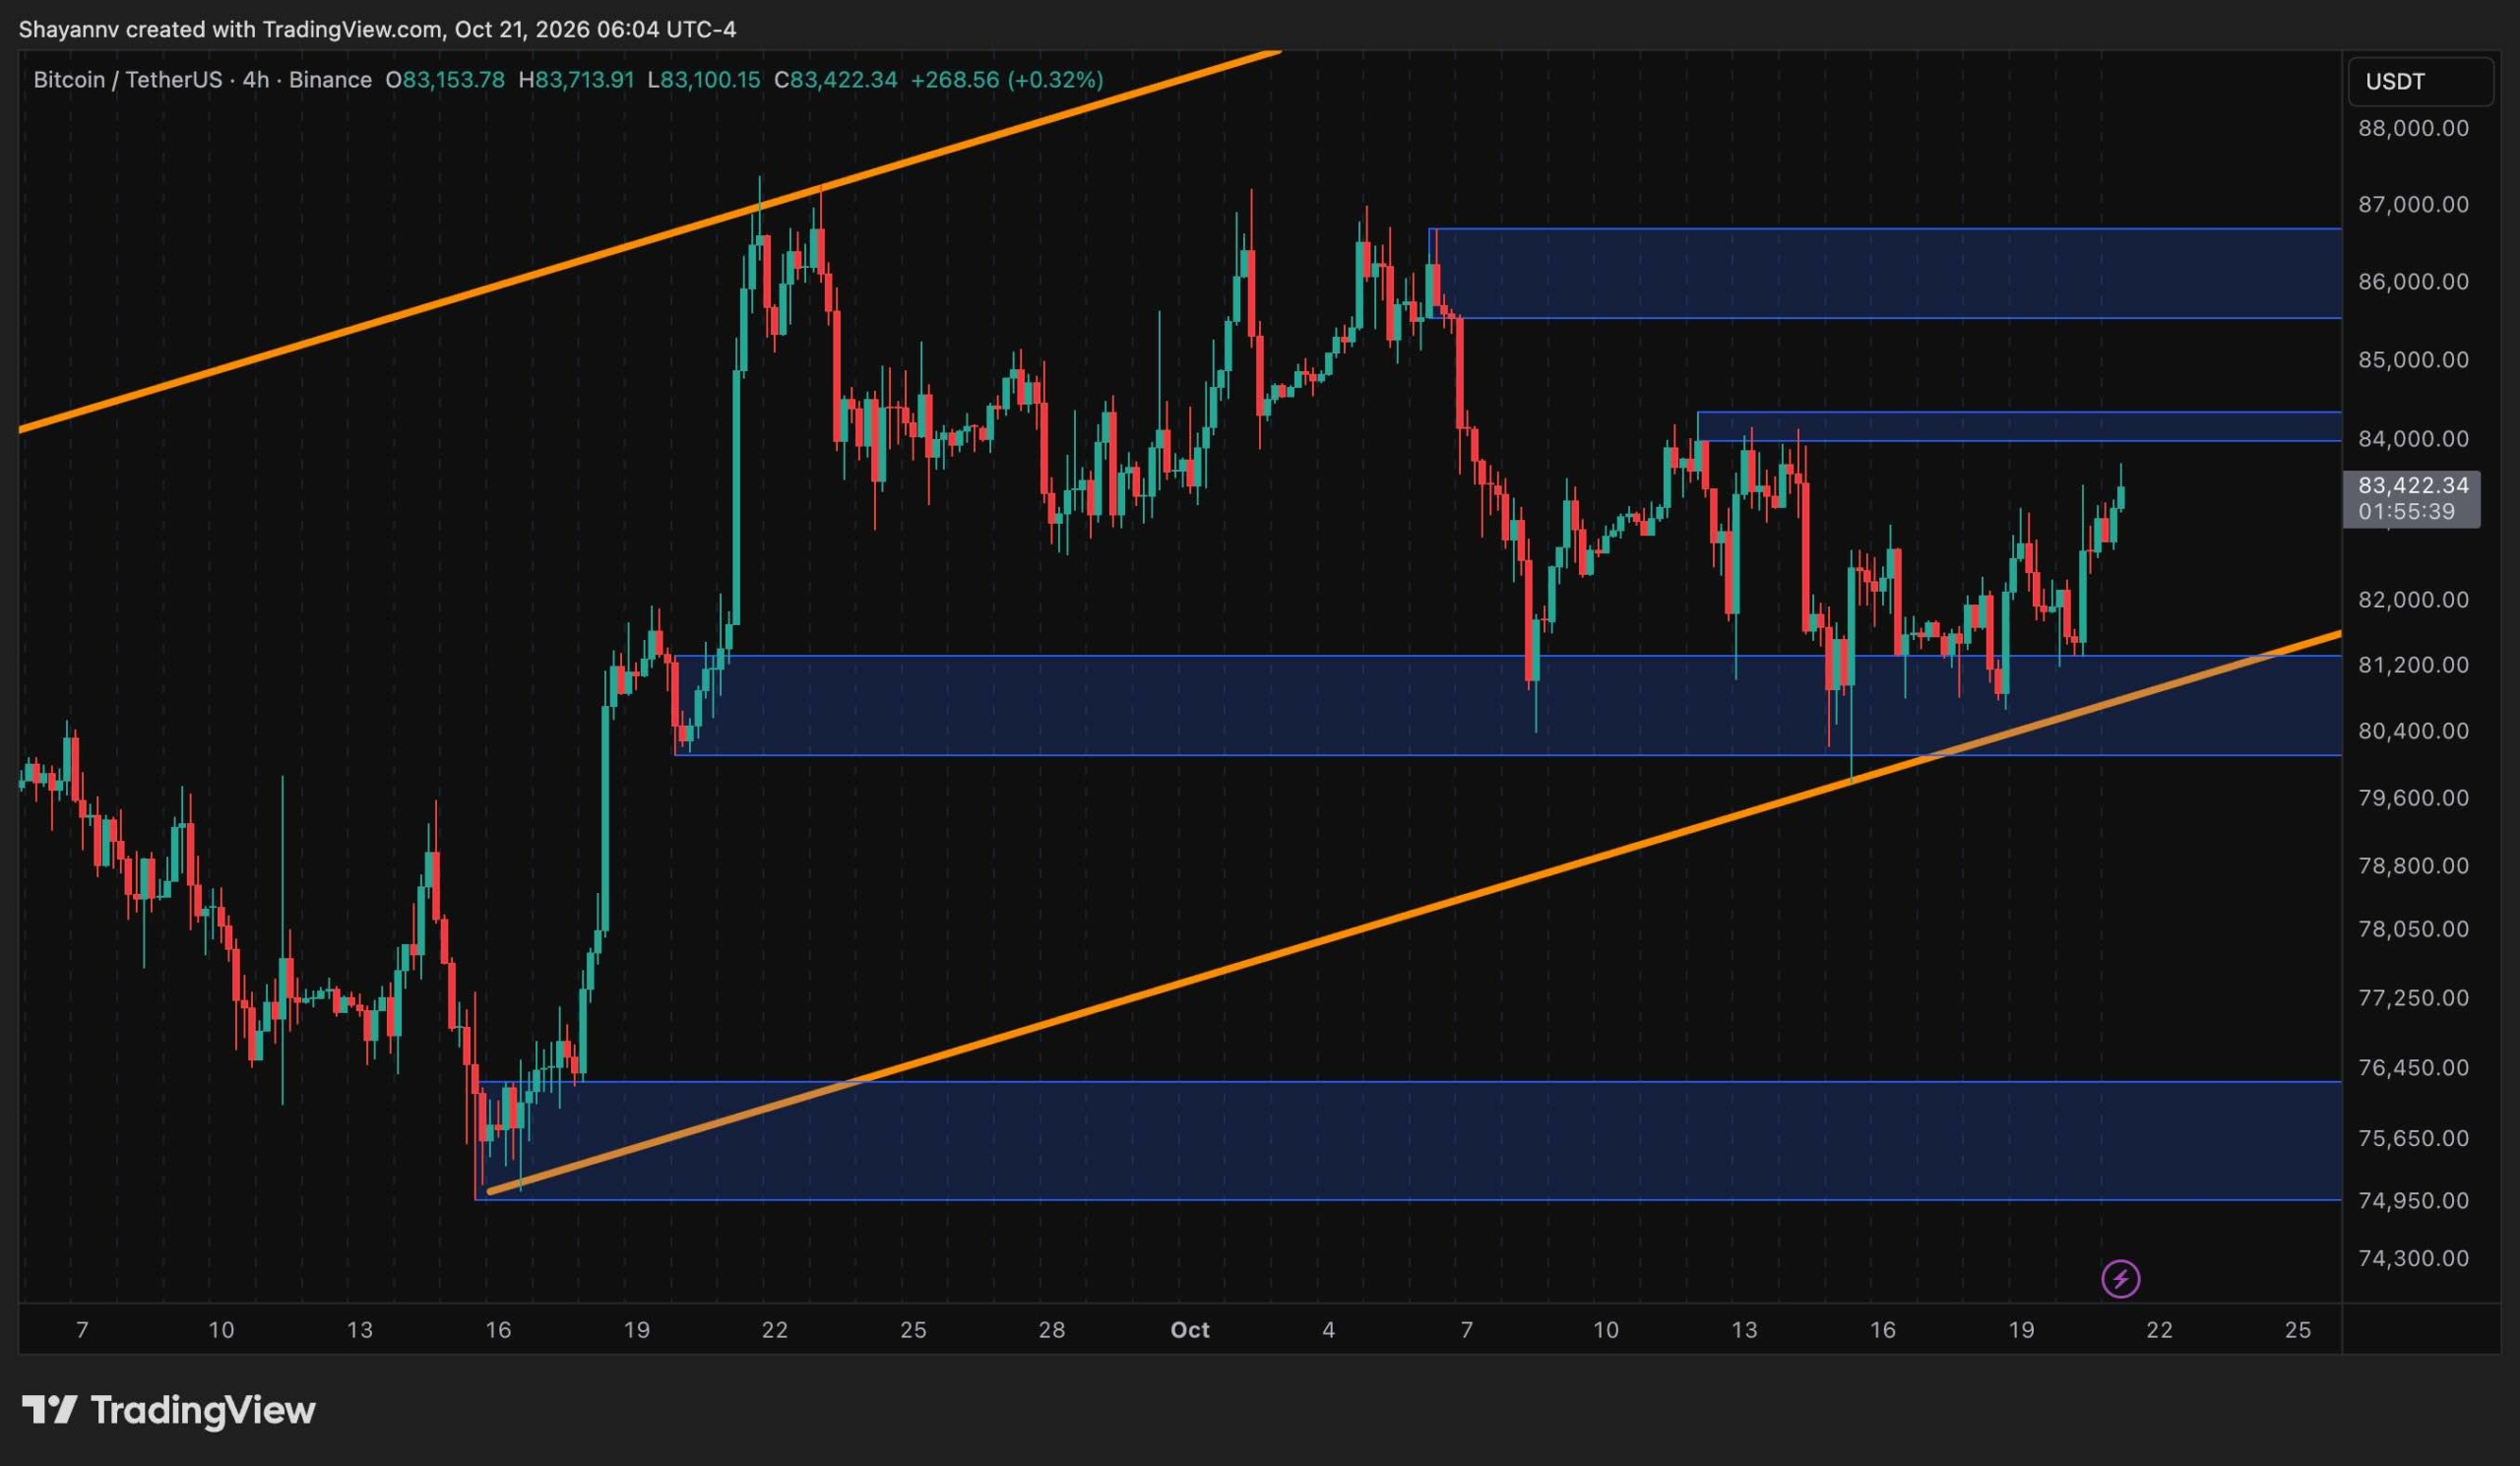
The nvm ratio on cryptoquant stacks bitcoin market cap against the square of daily active addresses based on metcalfe’s law where network value grows with the square of users. Active addresses proxy real economic use so a rising ratio means valuation is outrunning activity.
Its 30 day ema peaked above 4.5 during bitcoin’s 2025 run to ath then climbed back near 4.4 in january 2026 right before the february drop to 65k. After sinking to around 3.0 in august the metric rebounded to roughly 4.1 even though btc trades about a third below its peak 🦇.
This alone is not a sell signal since etfs and custodians pull tons of bitcoin activity off chain and likely lift the ratio over time. Still the high reading means thinner valuation support from network usage so that 80k demand zone matters even more short term 🌙.
Just another echo from the void by iconofsin.eth 💖
