XRP Stands Firm at Support: Peering Into Ripple’s Next Twists 🎲🦇

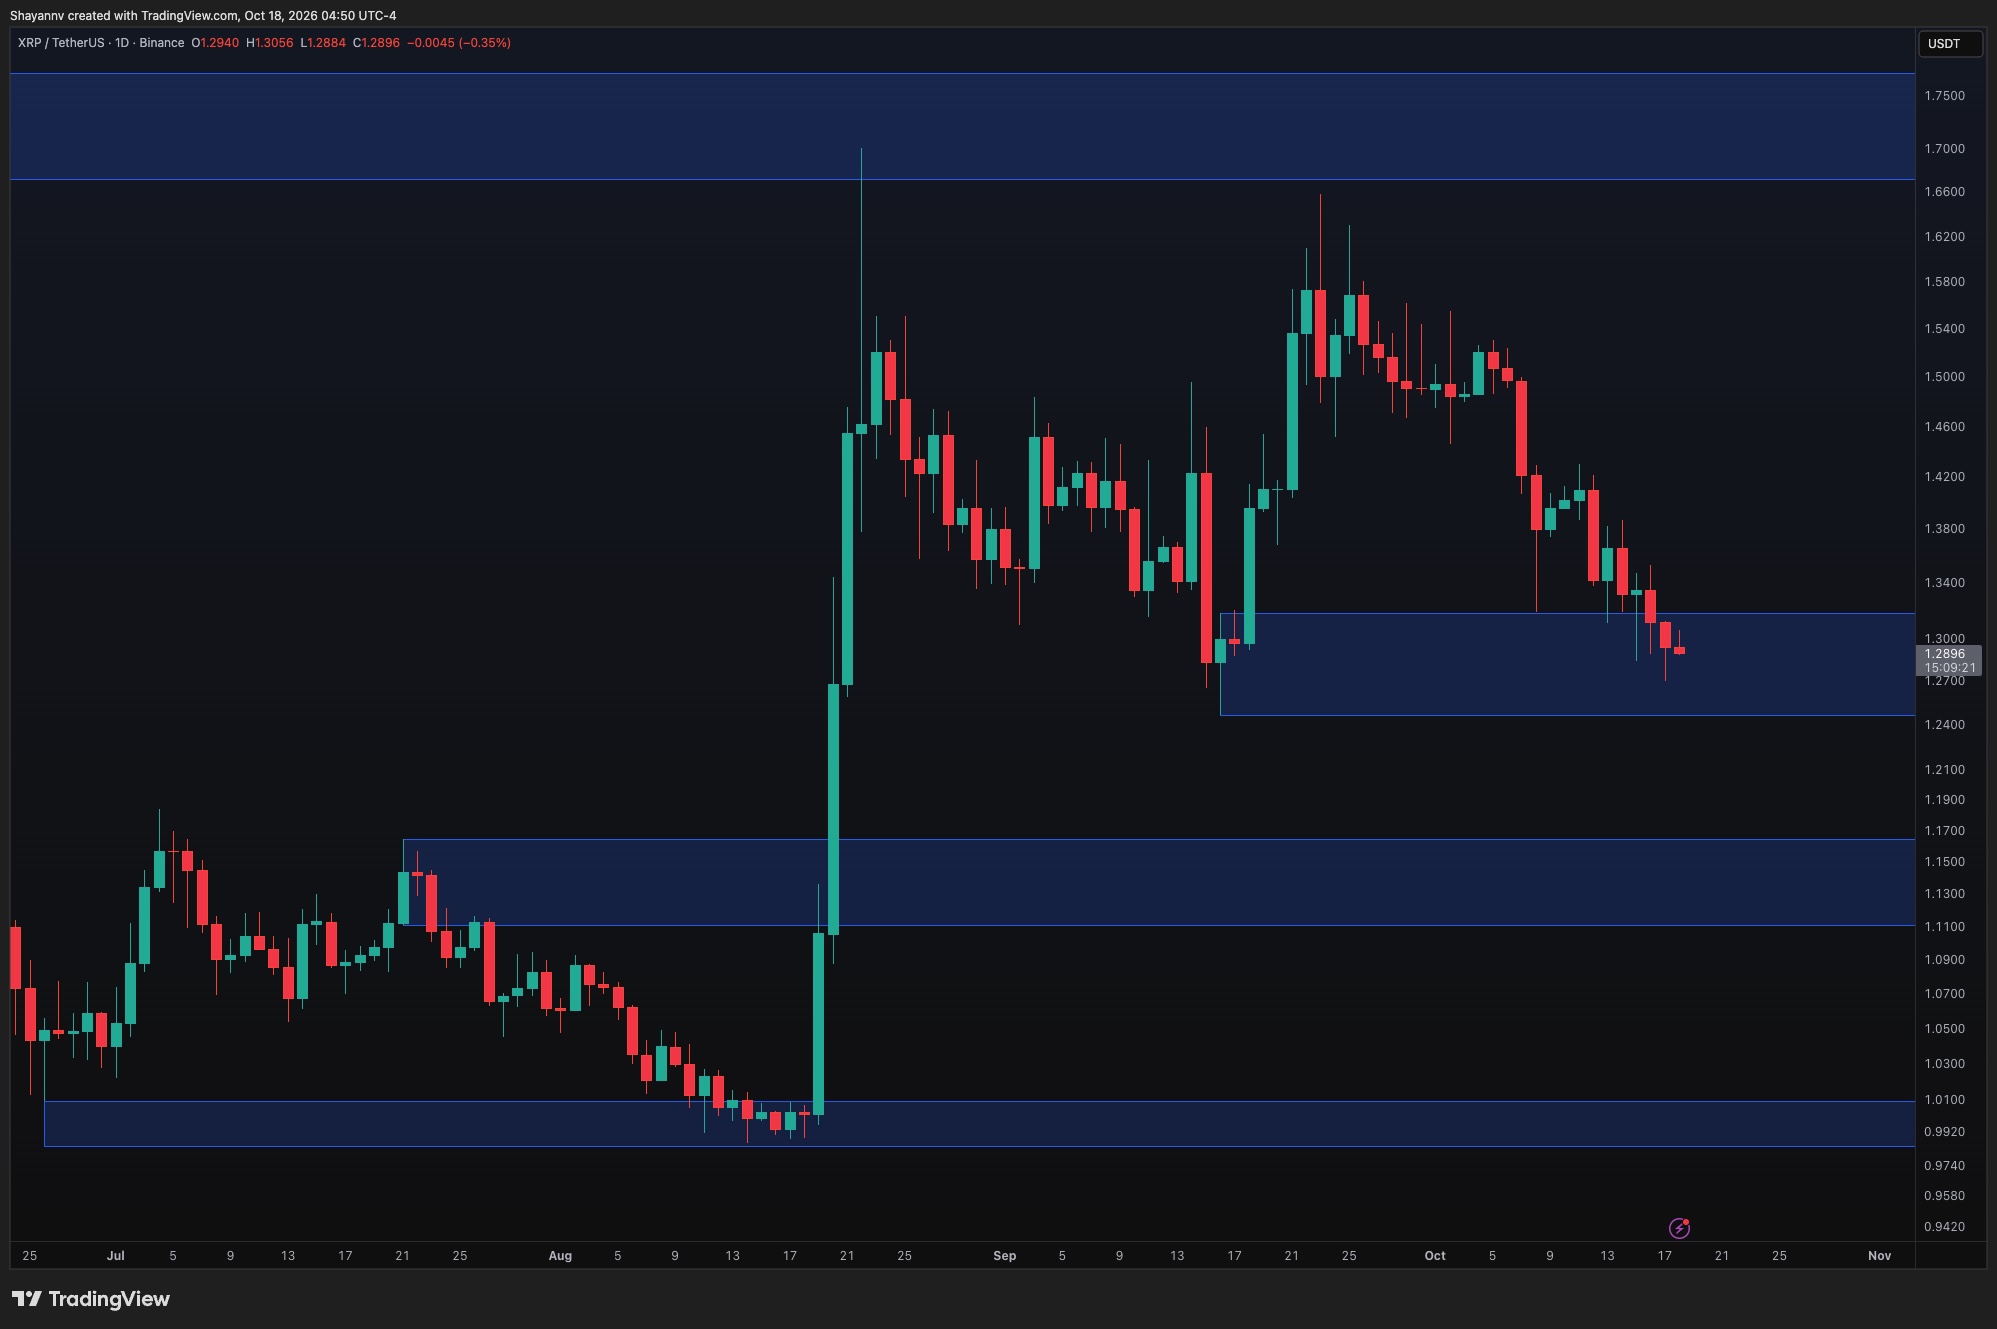
XRP slid right into that juicy demand zone near 1.30 bucks and ditched even more of September’s glow up. Nearby support might spark a quick bounce but those lower highs and lows keep screaming bearish vibes rn 🖤.

Daily XRP Chart Breakdown 💀

On the daily chart XRP crashed into the 1.24 to 1.32 zone after losing its grip on the 1.40 rebound. Those back to back red candles show sellers holding the leash tight and price is knocking on the same spot that fueled September’s big push ✨. This area matters a ton but buyers still haven’t shown up strong yet 🌙. If it holds and reclaims 1.32 that could open the door to 1.38 to 1.42 next. Slip under 1.24 tho and watch out for a deeper dive toward 1.11 to 1.17.

Four Hour XRP Flow Check 🕸️

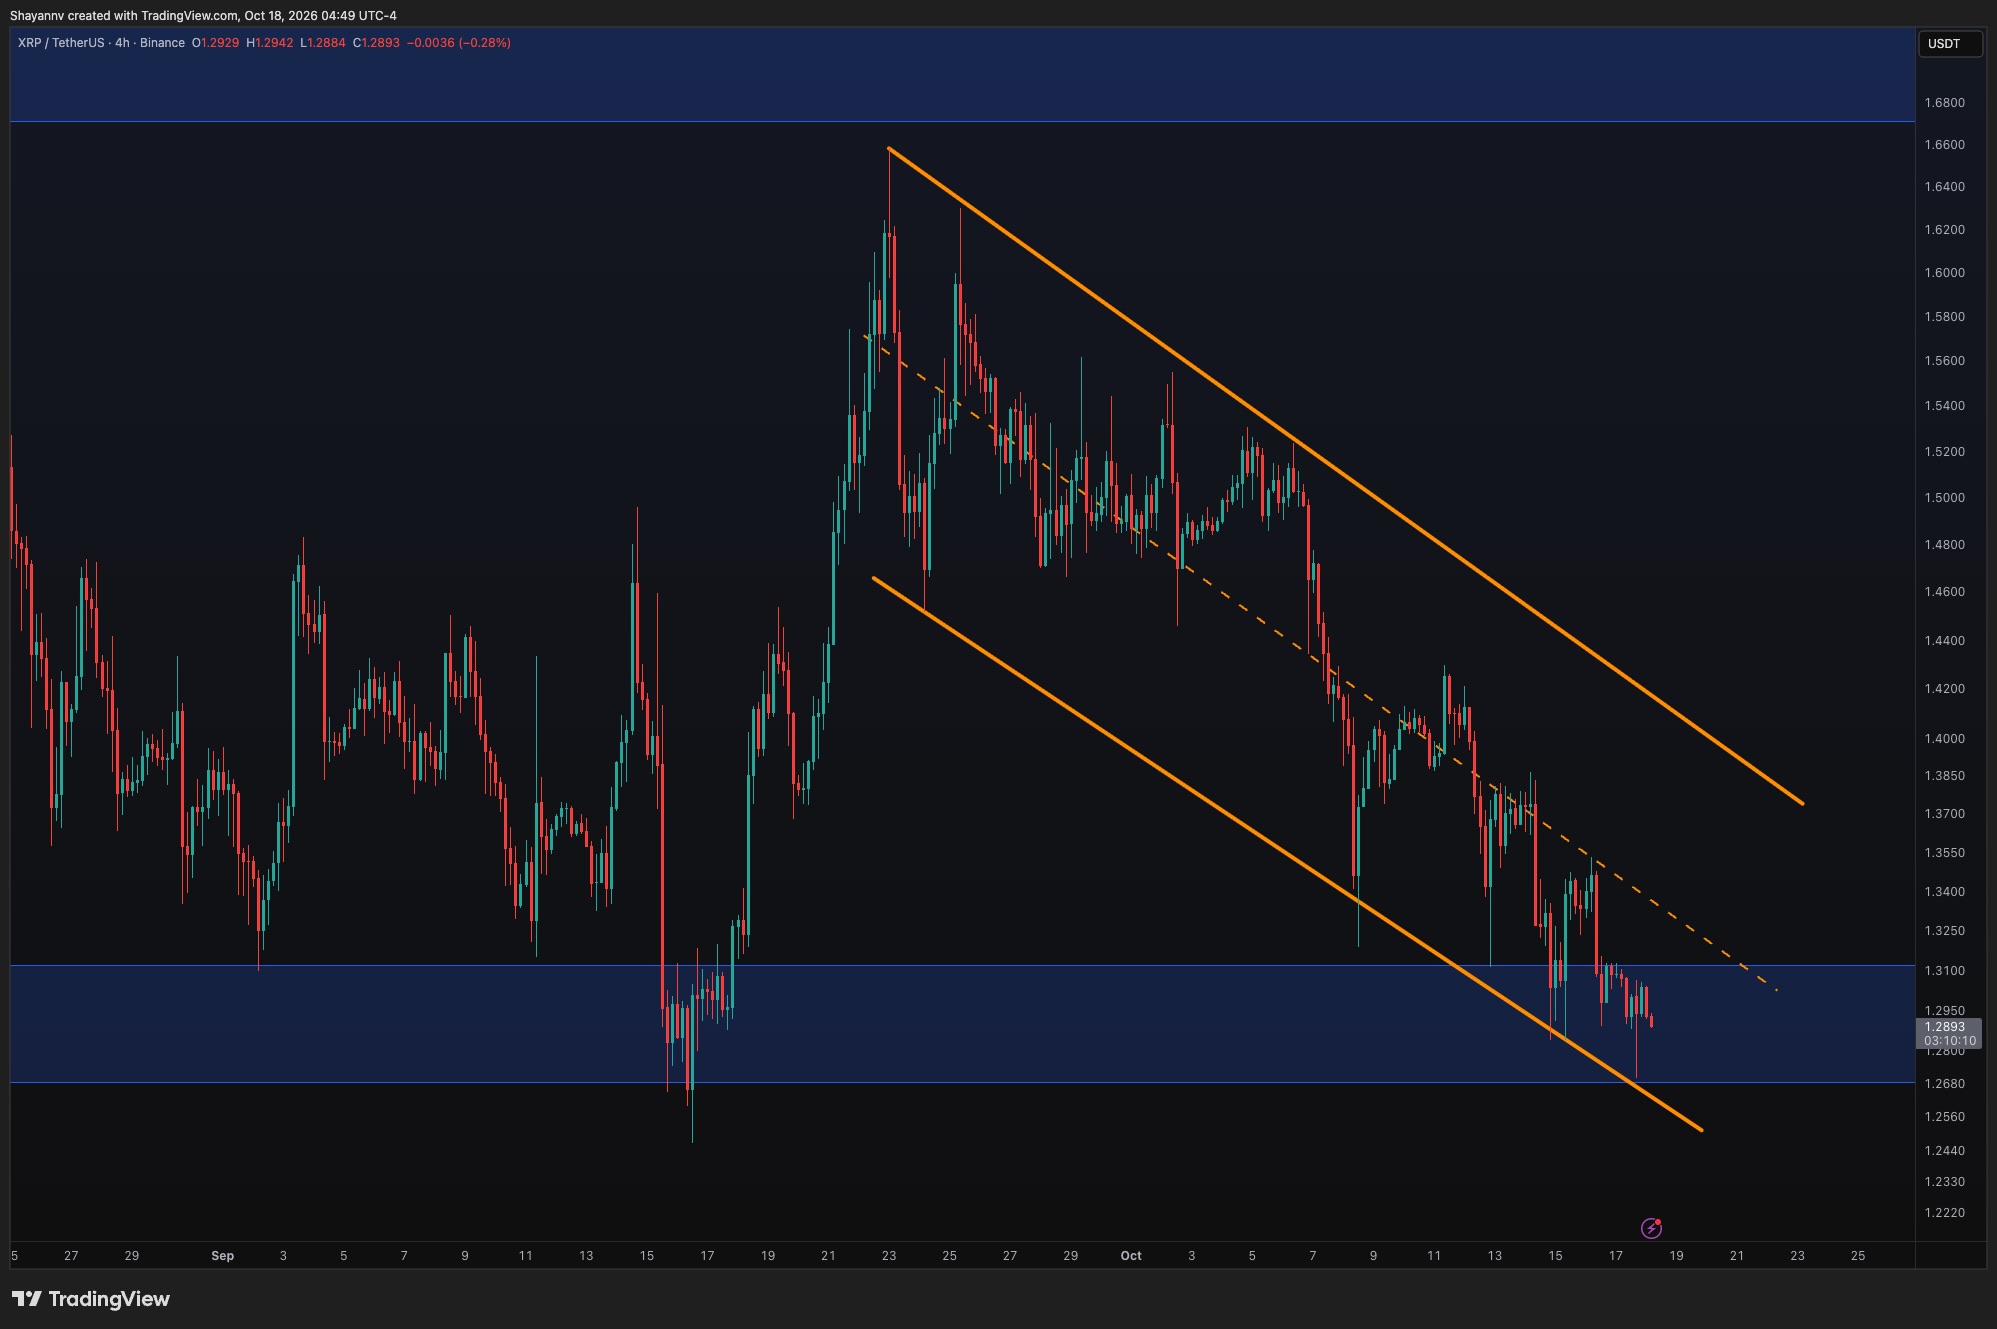
The four hour view keeps XRP trapped in that descending channel where every rally dies under the middle line. Now it’s sitting in the 1.27 to 1.31 pocket right at the channel floor 👀. This spot might pull in some quick buys for a bounce but it needs to flip 1.31 and then 1.32 to 1.33 first or the bearish streak keeps rolling. Push higher and 1.34 to 1.35 then 1.39 to 1.40 come into play. Lose 1.27 and things head back to 1.25 with real selling pressure building lmao 📉.


Just another echo from the void by iconofsin.eth 💖


Maybe you like what i'm doing here and wanna support me via the ethereum blockchain: iconofsin.eth 💖

US Hoarding Bitcoin While Spilling Digital Dollars, What’s Brewing? 🖤🦇

A fresh report dropped from Chainalysis and it’s wild how the United States flipped into net importing bitcoin this year while still pushing those dollar backed stablecoins out to the whole world 🖤.

Institutions Dragging All The BTC In 🪙

The data shows the US turned into a net importer of BTC for the first time since 2022. Retail flows under 10000 dollars kept heading out but those bigger institutional moves slammed the other way harder. The 10 million plus bracket alone pulled 53200 BTC straight into the country ✨. Retail users are shipping bits out while US institutions are yanking them back in fr. Chainalysis ties this shift to the spot Bitcoin ETFs boosting the US slice of global crypto action since early 2024.

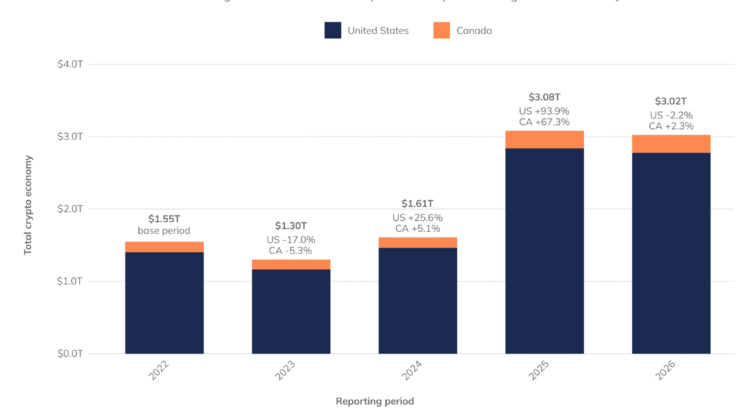
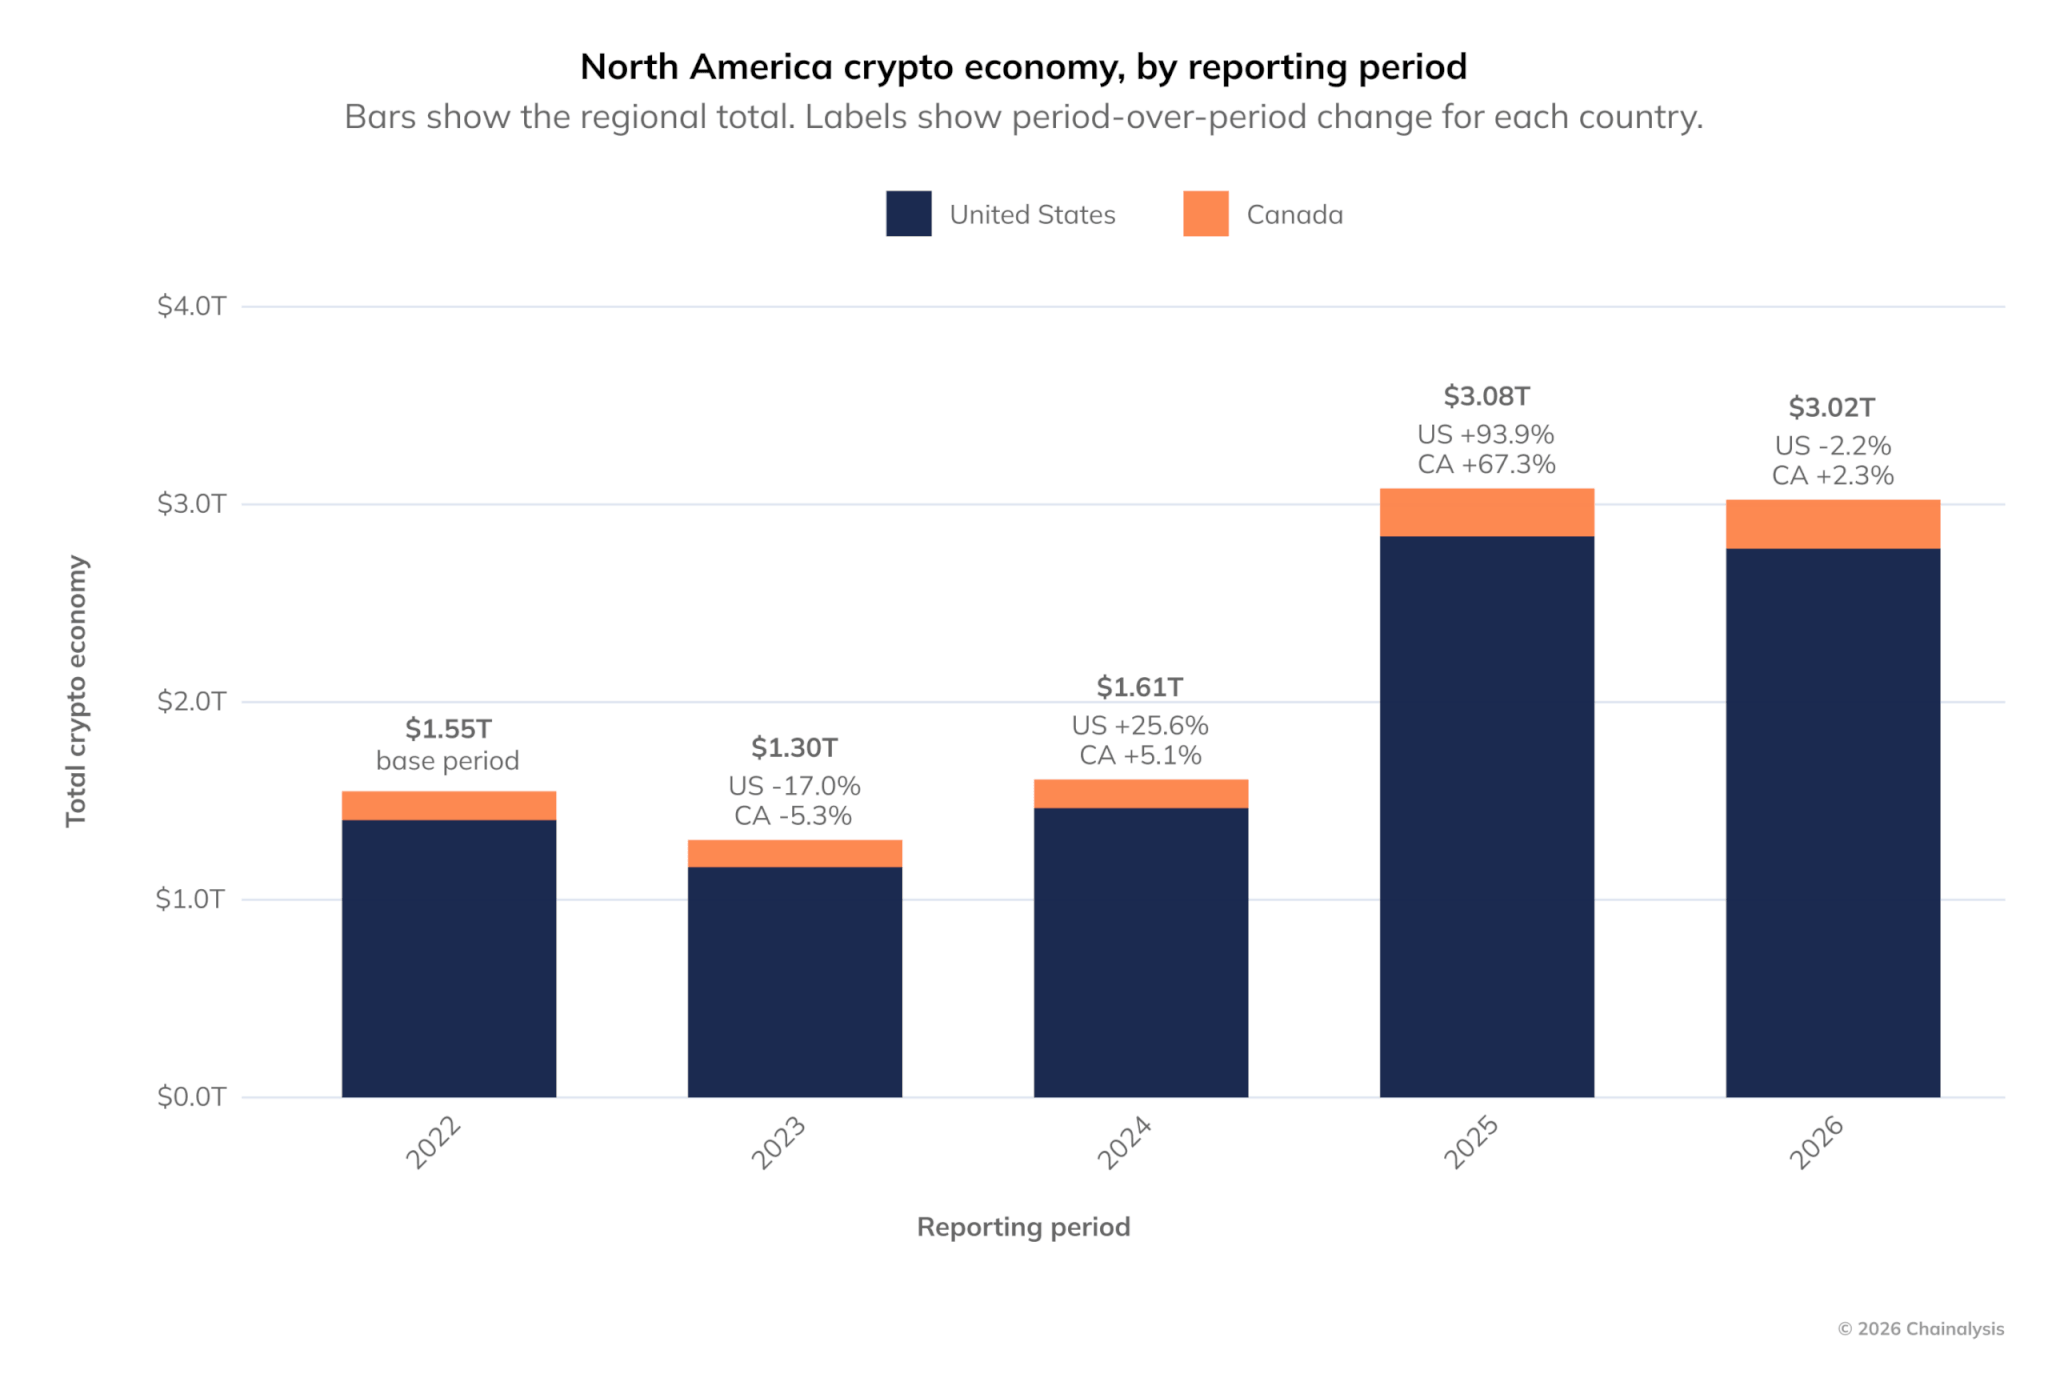
North America Crypto Economy

This lines up with BTC sliding away from exchange wallets into ETF vaults and corporate stacks 💀. Chainalysis also flagged how the US Strategic Bitcoin Reserve adds quiet sovereign pull even without big federal buys yet 🌙.

Everyone Outside Craves Tokenized Dollars 💵

Stablecoin order book volume stays 99.1 percent tied to the greenback 🕸️. Users beyond the US lean on these assets to grab dollars without needing a local bank account 🦇. Stablecoin issuers park reserves in short term US debt so the flow loops back into American markets 🔮. The RWA sector blew past 36 billion dollars in Q2 with a 135 percent jump from before and tokenized US Treasuries alone hit 15.42 billion dollars or 43 percent of it all 📈. Overall the vibe is clear foreign demand is chasing tokenized dollars and debt while US institutions stack more BTC 💰.


Just another echo from the void by iconofsin.eth 💖


Maybe you like what i'm doing here and wanna support me via the ethereum blockchain: iconofsin.eth 💖

Ethereum’s 7% Slide This Week—Is More Pain Creeping In? 🖤🦇

Ethereum is testing this super critical support zone below $2.4K while the correction keeps dragging on fr. Buyers are holding the line with some sharp bounces rn but those lower highs are screaming that selling pressure ain’t easing up yet 🖤.

Daily Chart Chaos 🌑

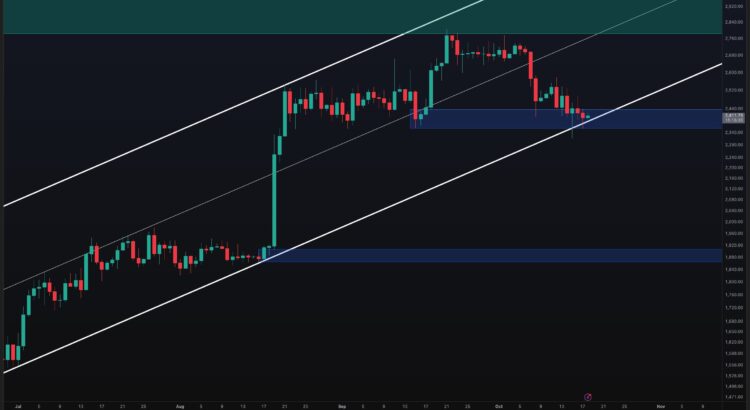
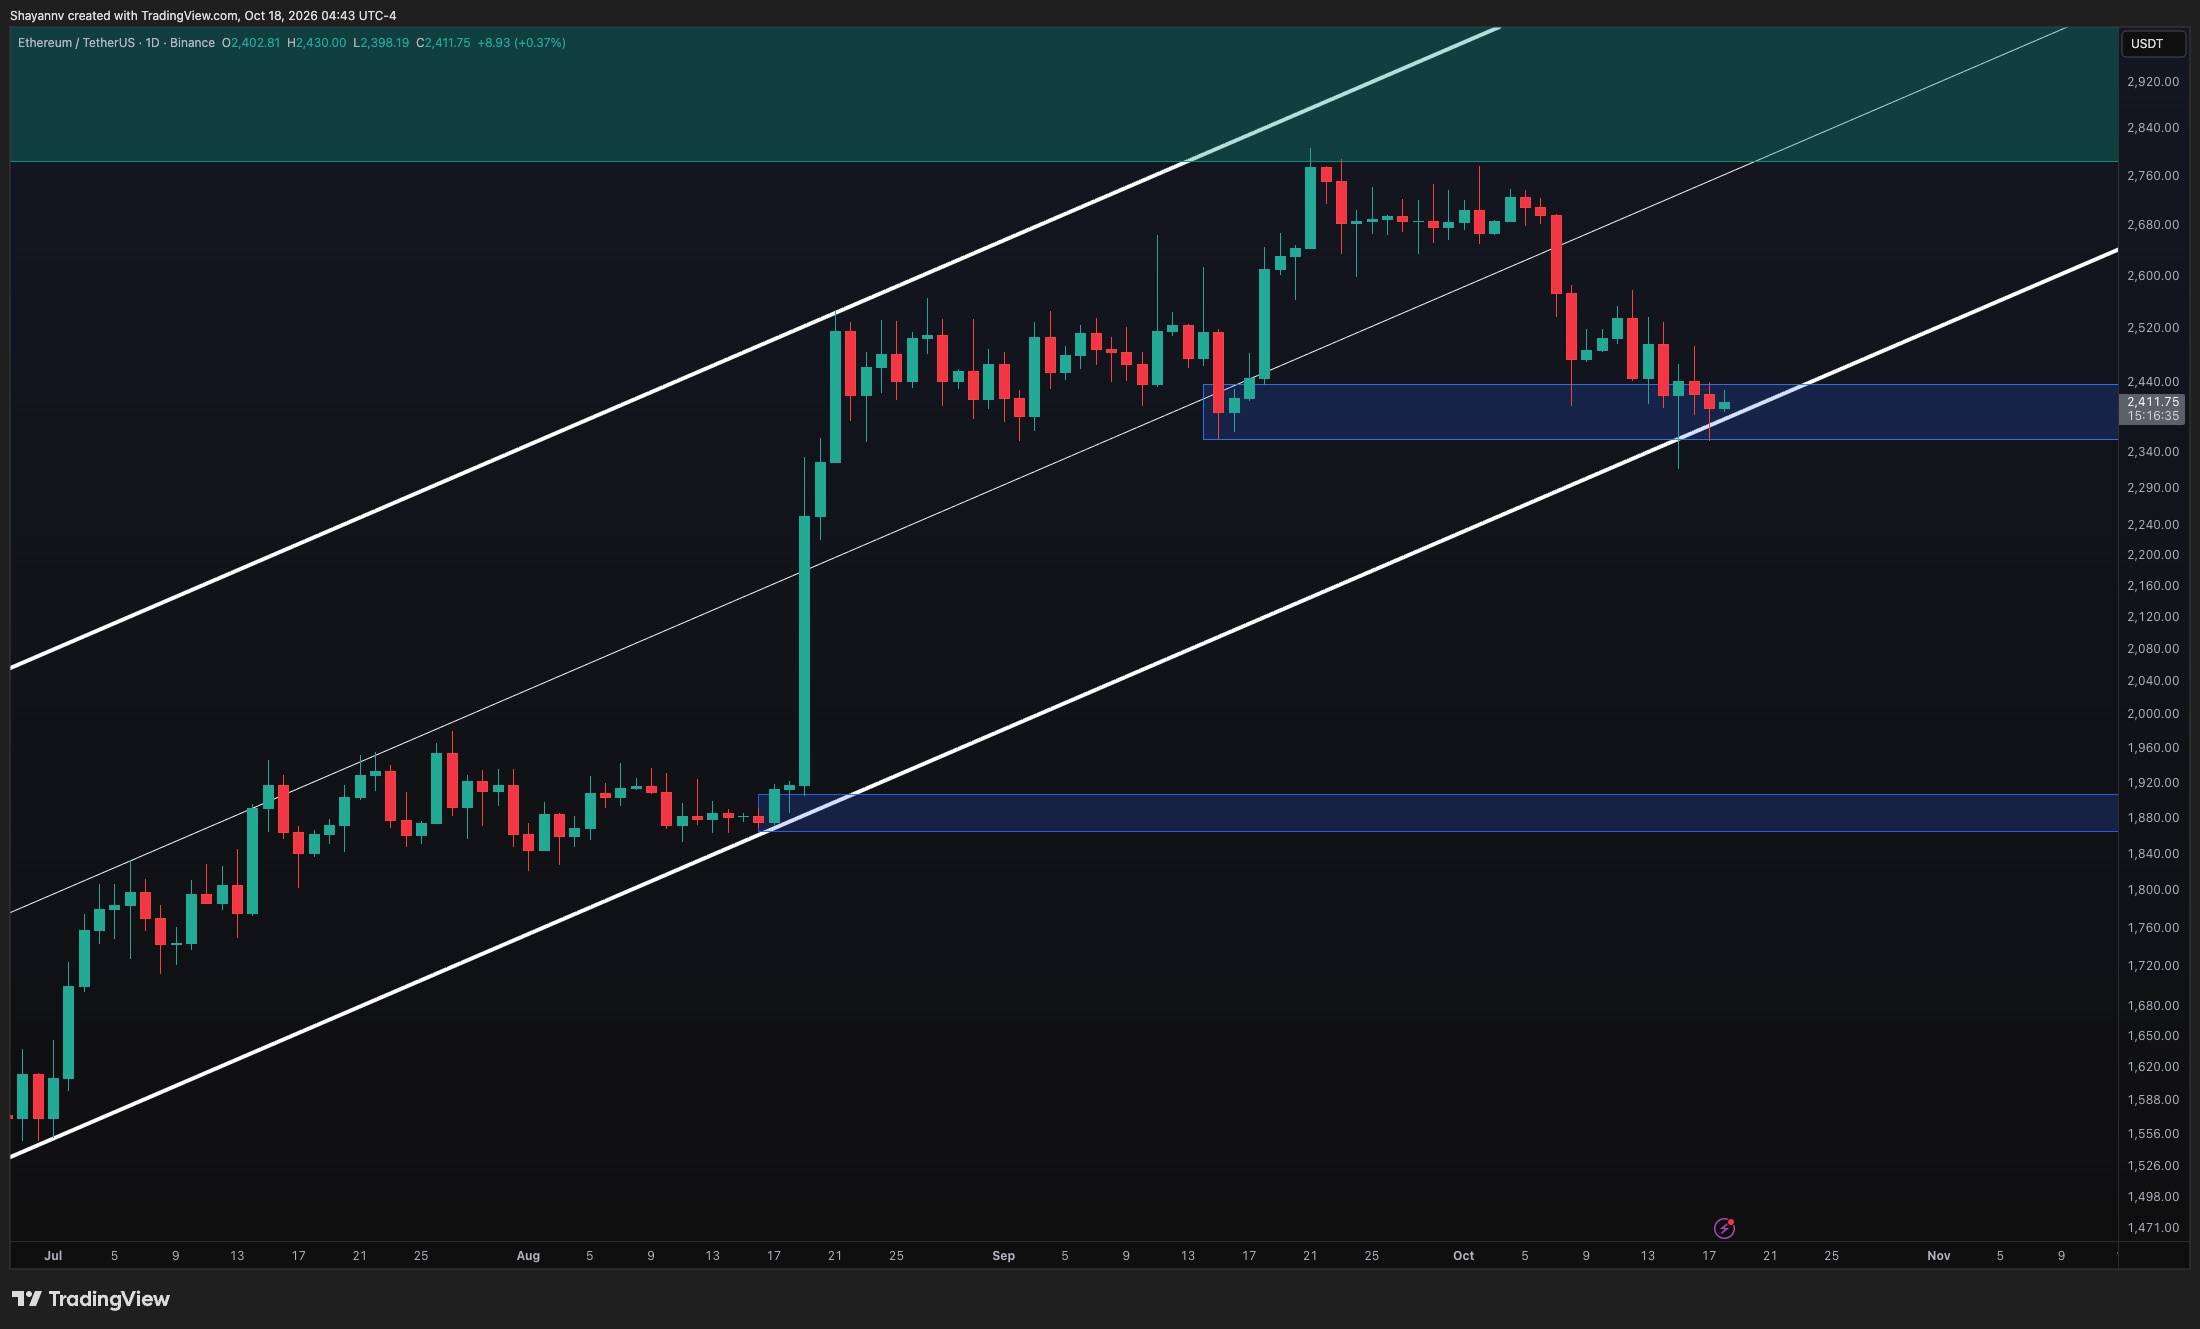
On the daily timeframe ETH has slid right into that highlighted $2.36K–$2.44K demand zone where the ascending channel’s lower edge adds extra support vibes. The asset is chilling near $2.36K with recent wicks showing buyers lurking underneath the consolidation 💀.

Those quick reactions haven’t sparked any real sustained bounce tho. Since slipping past the channel midpoint ETH keeps printing lower highs which makes the near term outlook look kinda fragile. To show real strength buyers gotta reclaim the $2.44K boundary first then smash through the $2.5K–$2.56K resistance zone.

Holding this confluence spot could fuel a climb toward the old consolidation around $2.67K–$2.74K. But a firm daily close under $2.36K and the channel line would break the bigger recovery setup raising risks of a deeper dive toward $2.2K.
4 Hour Descent Vibes ⚰️

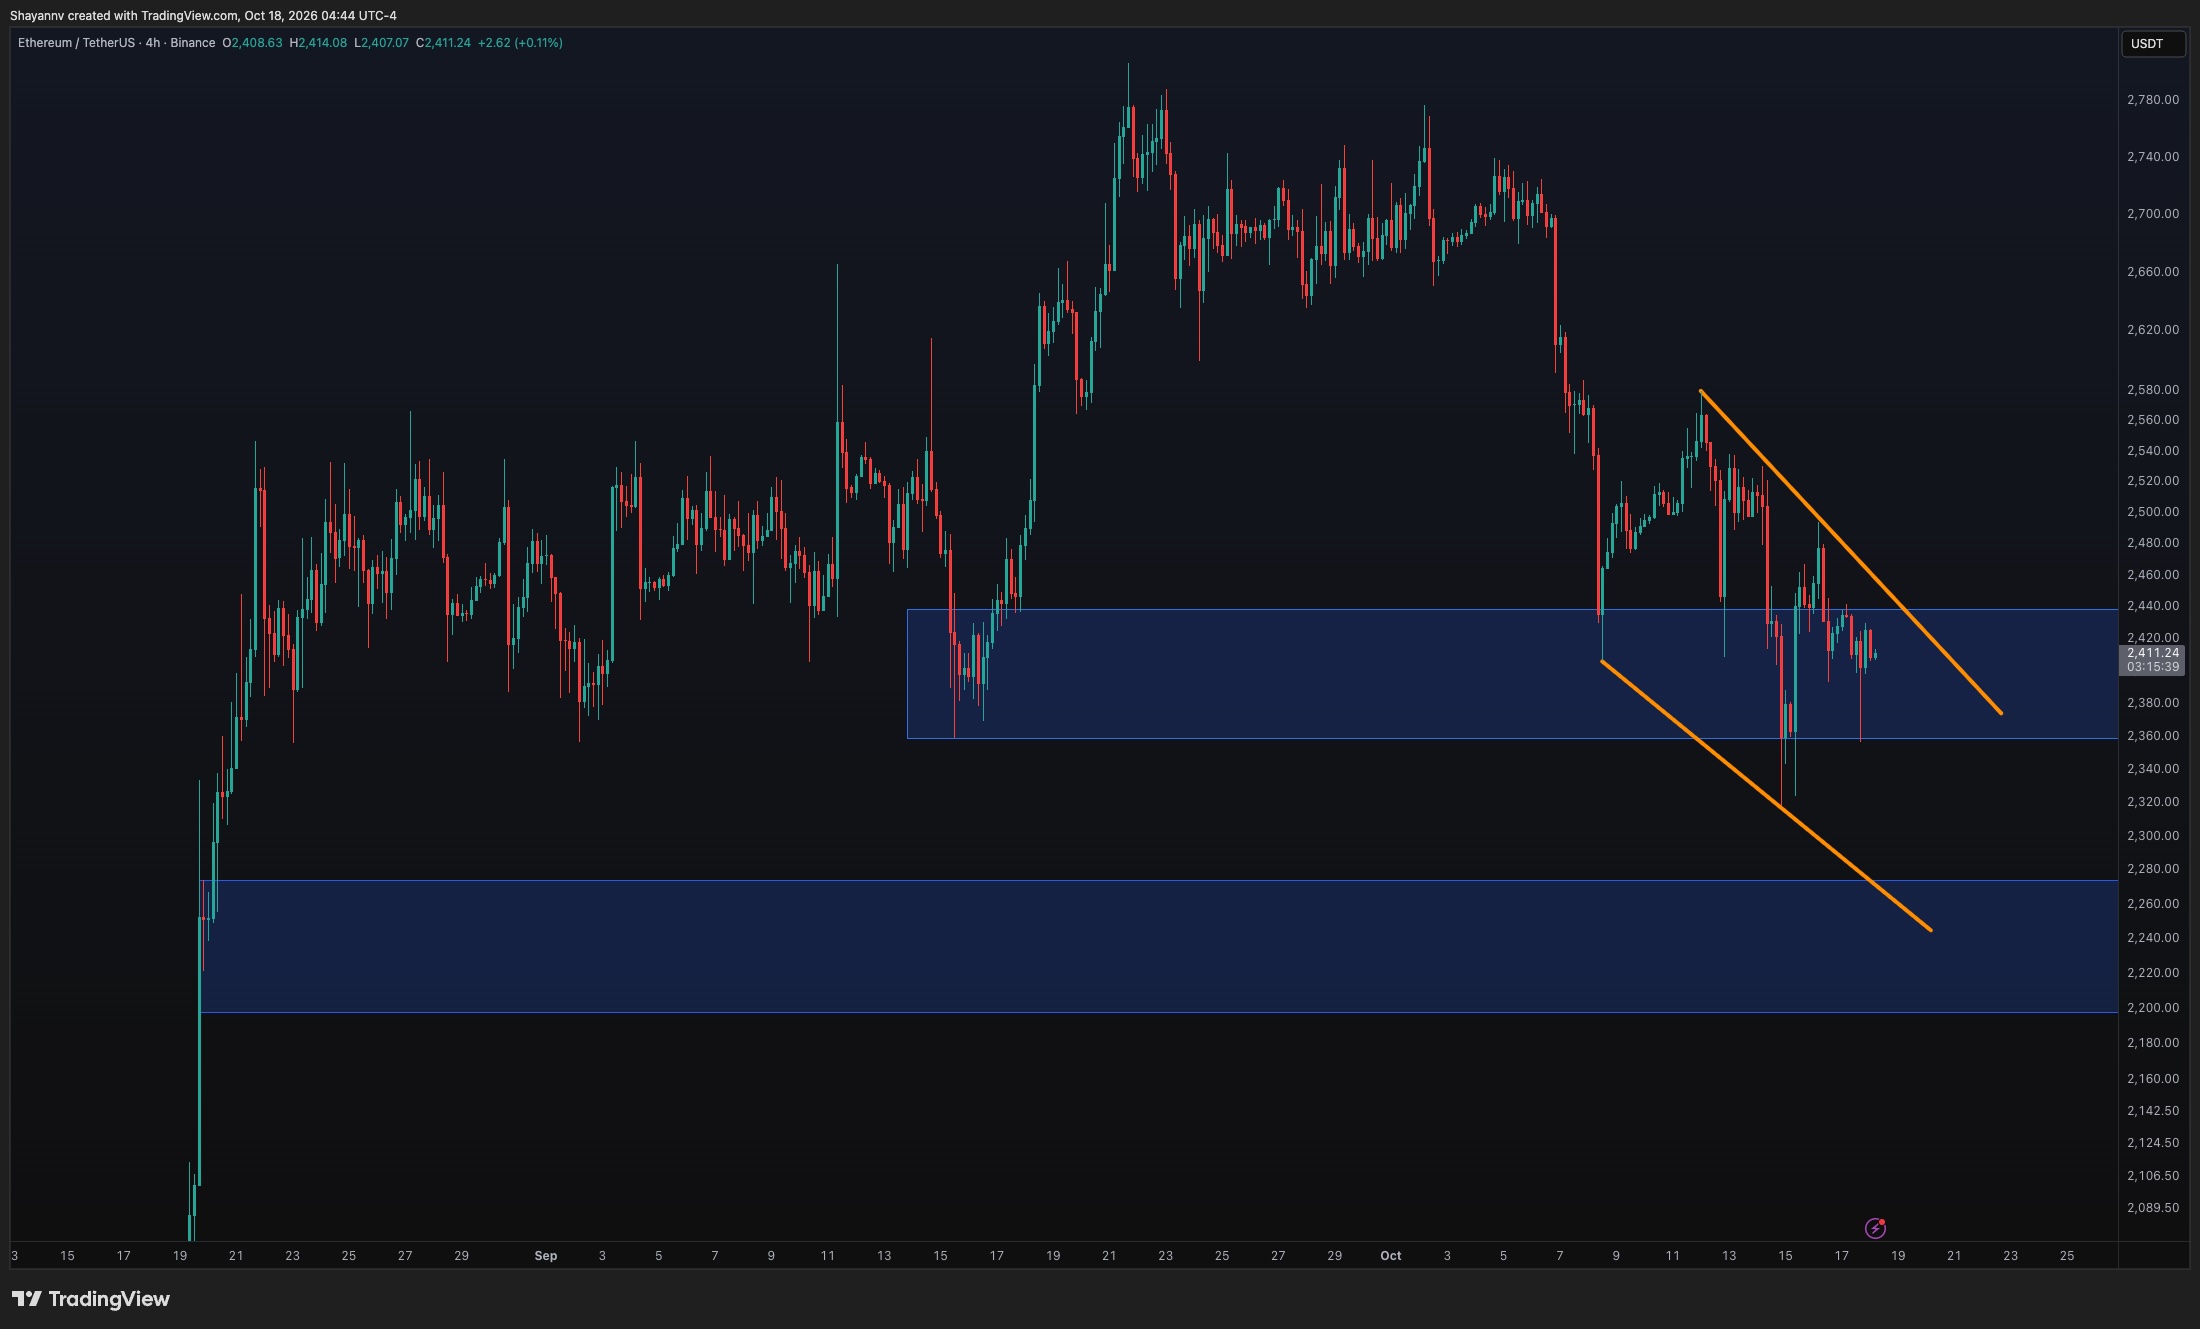
The 4 hour chart has ETH trapped inside a descending channel after that sharp early October selloff. Multiple rebounds keep failing at the upper trendline while latest candles are consolidating inside the $2.36K–$2.44K demand area 👻.

Descending resistance is nearing $2.45K–$2.47K making that the first big hurdle for any recovery. A solid break above the demand zone top and this trendline would pause the bearish move and open doors toward $2.5K–$2.58K.

Until then another test of $2.35K stays possible. Losing that would expose wick lows near $2.32K followed by the $2.2K–$2.27K demand zone. The channel’s bottom edge lines up there too making it key if the drop extends further.
Sentiment Heatmap Spooks 🔮

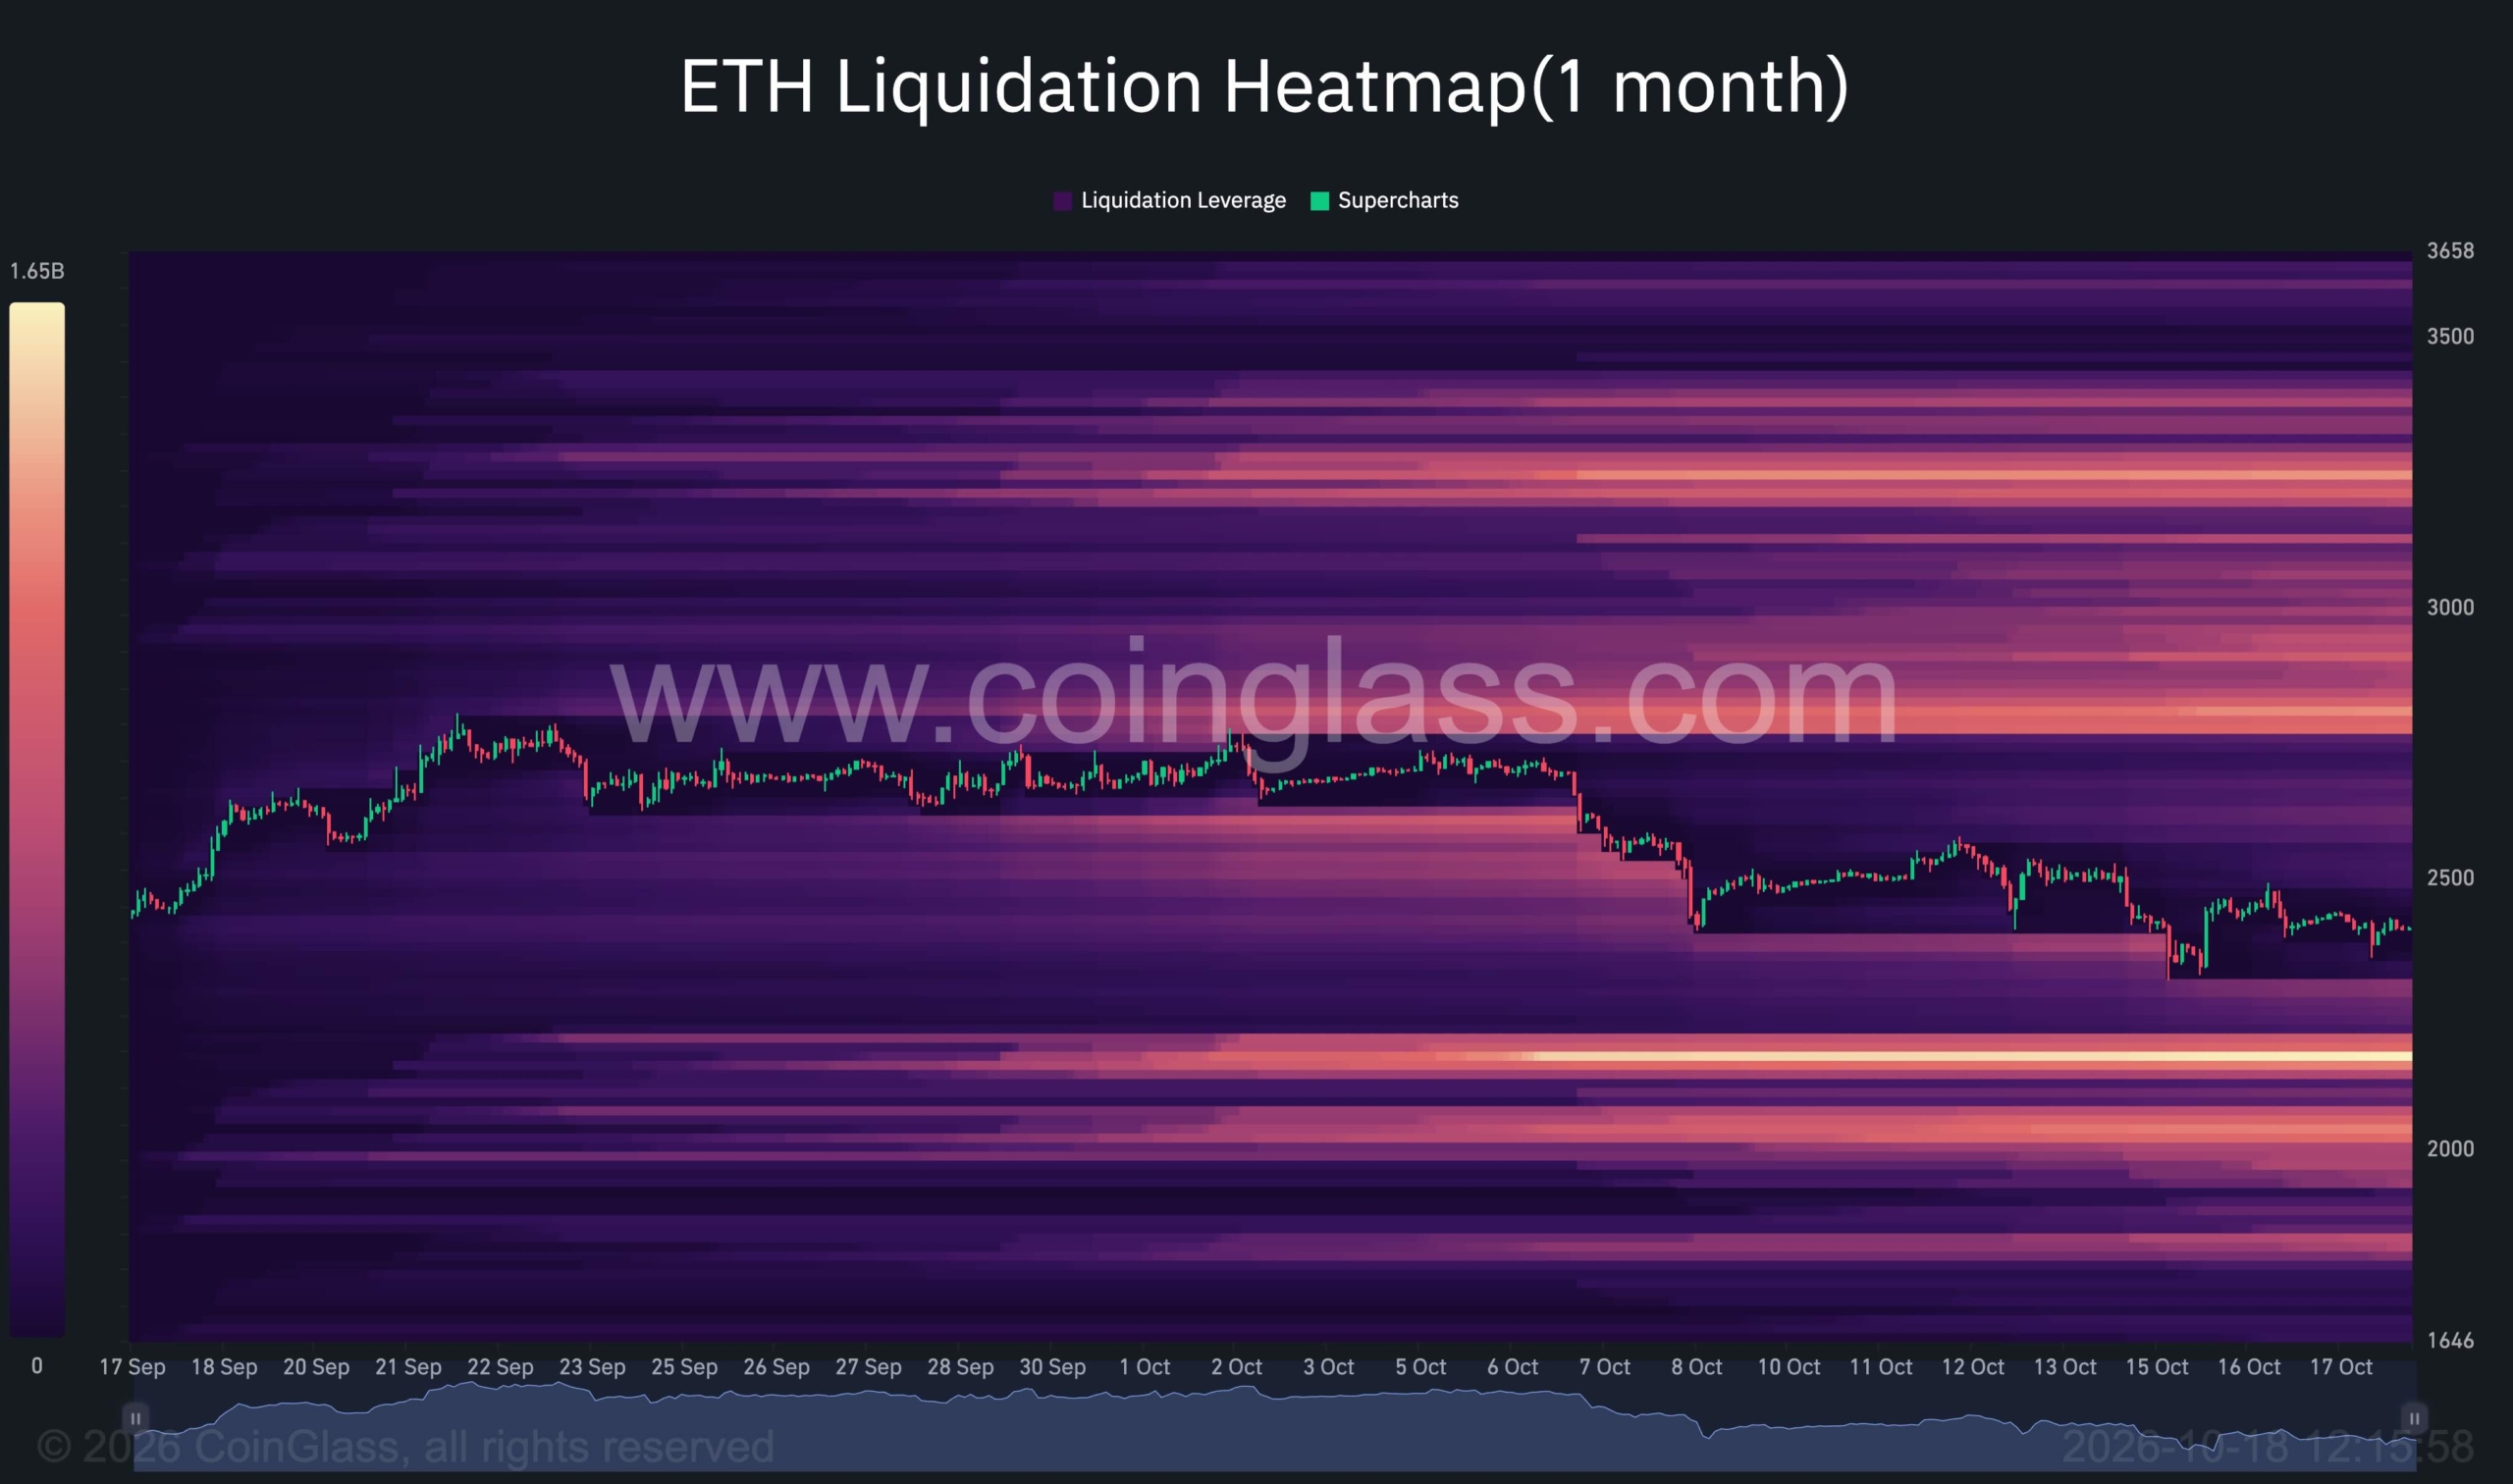
The one month ETH liquidation heatmap shows a huge cluster around $2.15K–$2.2K sitting above the $2K psychological mark. This bright band has stayed visible over sessions hinting at major liquidation exposure below current prices 🦇.

It gets extra spicy if ETH drops the $2.36K support and the ascending structure. Further declines could trigger long liquidations near $2.2K speeding into that liquidity pool.

Its closeness to the $2.2K–$2.27K technical demand adds weight to the zone but remember it signals forced selling risk not guaranteed support. A steady climb above nearby resistance would drop its relevance while ongoing weakness keeps it in focus.

Just another echo from the void by iconofsin.eth 💖


Maybe you like what i'm doing here and wanna support me via the ethereum blockchain: iconofsin.eth 💖
Three Intriguing Bullish Angles On Dogecoin But Should You Trust Them? 🖤🌙

We’re so far from that meme-coin hype cycle that shook everything up where fresh tokens kept spawning left and right just to snag eyeballs and that sweet deployable capital 🖤.

Why I’d Peek At DOGE Again 🐕

Ali Martinez just dropped his take on why to eye DOGE rn starting with that TD Sequential lighting up a huge buy signal on the daily around $0.081. The coin dipped under it tho and sits below $0.08 right after that wild flash crash recovery. Still he stays sure this technical vibe will nail it for DOGE saying the indicator nailed turning points for it before especially with this spot 🌑. He flagged the same $0.081 as key support where URPD shows about 36 billion coins traded around there. He admits it ain’t a guarantee buyers will hold the line but thinks DOGE will bounce over it soon though that ain’t happened yet 📉.

Is The Bounce Real Or Nah? 💀

On the bigger picture the whole crypto scene feels nowhere near its peak lately not even close to that late Q3 early Q4 hype when BTC hit $87,000 and alts trailed along. So the overall bullish mood just ain’t here fr 😼. Picking DOGE out the meme pack it sits far from the 2021 high and even the later mania. It actually slipped outta the top 10 by market cap now. Spot DOGE ETF demand backs this up since net inflows sit basically nonexistent. Sure on-chain signals and technicals from a big analyst like Ali sound solid yet I’d tread careful with any call for a quick 100% pump in this kinda market 🔥.


Just another echo from the void by iconofsin.eth 💖


Maybe you like what i'm doing here and wanna support me via the ethereum blockchain: iconofsin.eth 💖