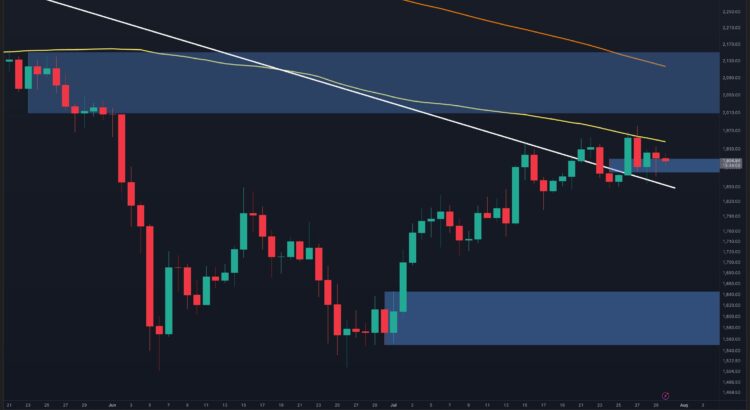
Ethereum keeps dancing in this spooky critical zone after its sharp bounce from those June lows. The bigger rebound is still holding on tight but the fresh moves hint that momentum’s slipping away while buyers and sellers clash under heavy resistance 🖤.
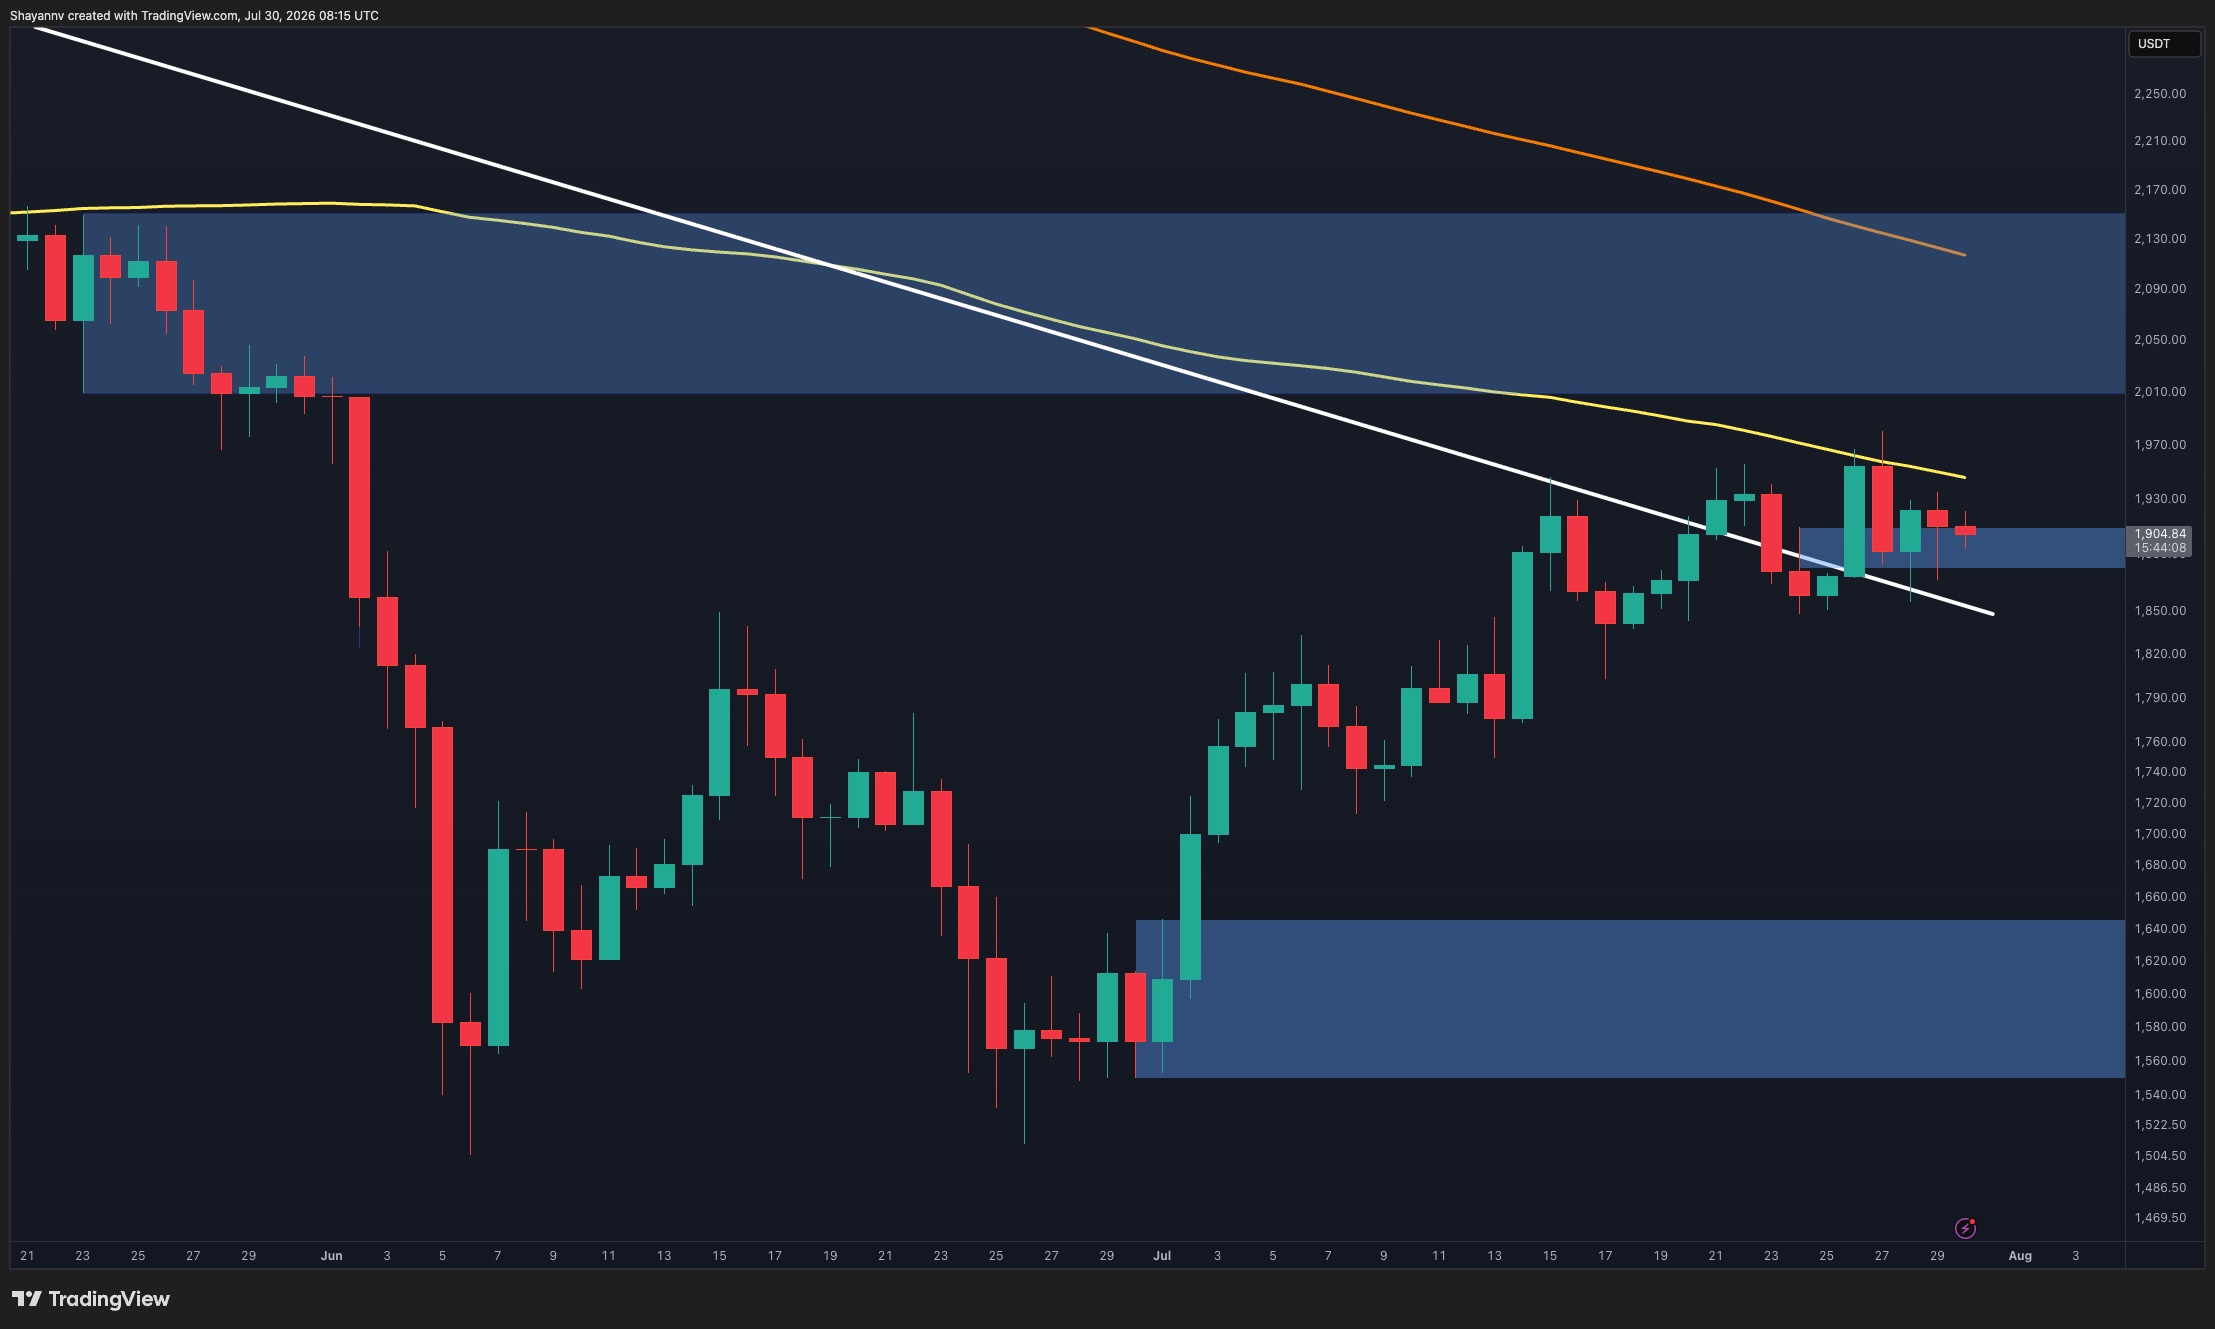
Daily Chart Breakdown 🌑
On the daily view Ethereum stays under both the 100-day and 200-day moving averages so the overall vibe feels guarded even after climbing from the June floor. That recent push stalled right below the 100-day MA near the 1950 region where sellers jumped in fast and dropped price back into the 1880 to 1910 supply pocket 🦇.
This pocket now serves as the nearest wall. A clean break above it would brighten the mid-term picture and open up the overlap of those moving averages sitting inside the 2020 to 2150 resistance band. Until that happens ETH could easily face another shove down 🔮.
On the lower side the 1750 to 1790 demand pocket stands as the first solid floor. Dropping past it would likely spark a deeper slide toward the major demand area near 1560 to 1640 💀.
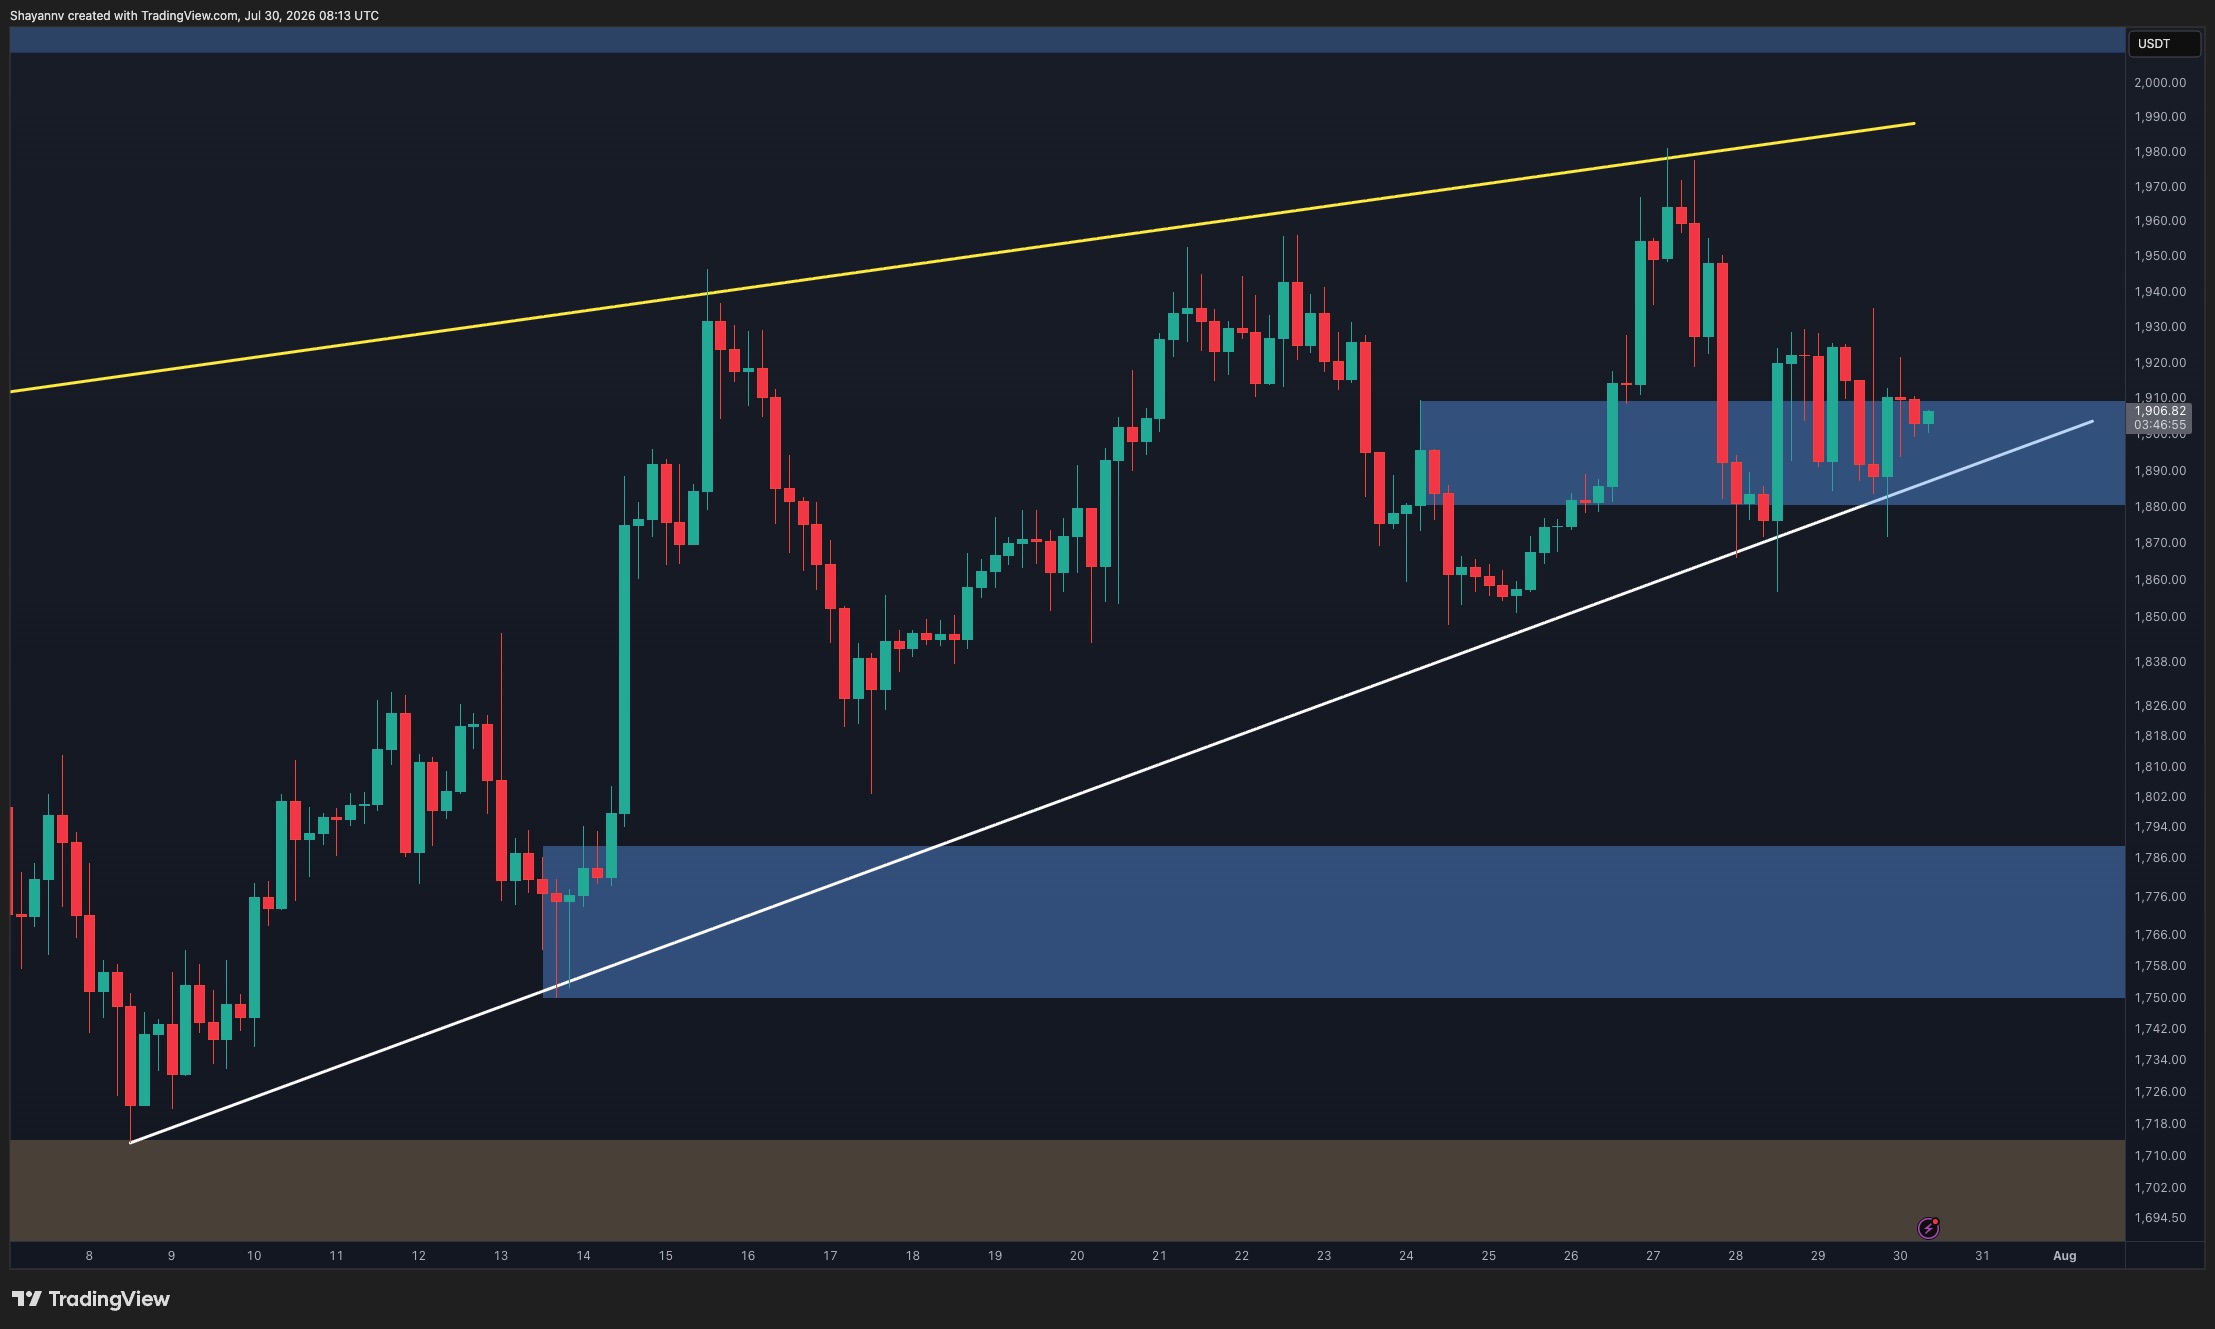
Four Hour Compression Chaos 🕸️
The four hour chart reveals Ethereum trapped inside a tightening pattern with price squeezed between that rising white line and the falling yellow line. This shrinking space shows growing hesitation since neither side has claimed a clear direction yet 🌙.
Ethereum sits consolidating around the 1880 to 1910 resistance band while still honoring the upward support line. A push past both that band and the descending line would likely boost bullish drive and open another run at the recent peaks 🩸.
Yet a slip below the white ascending line would break the string of higher lows and might speed up a drop toward the 1750 to 1790 demand zone where buyers should guard the broader recovery setup 🔮.
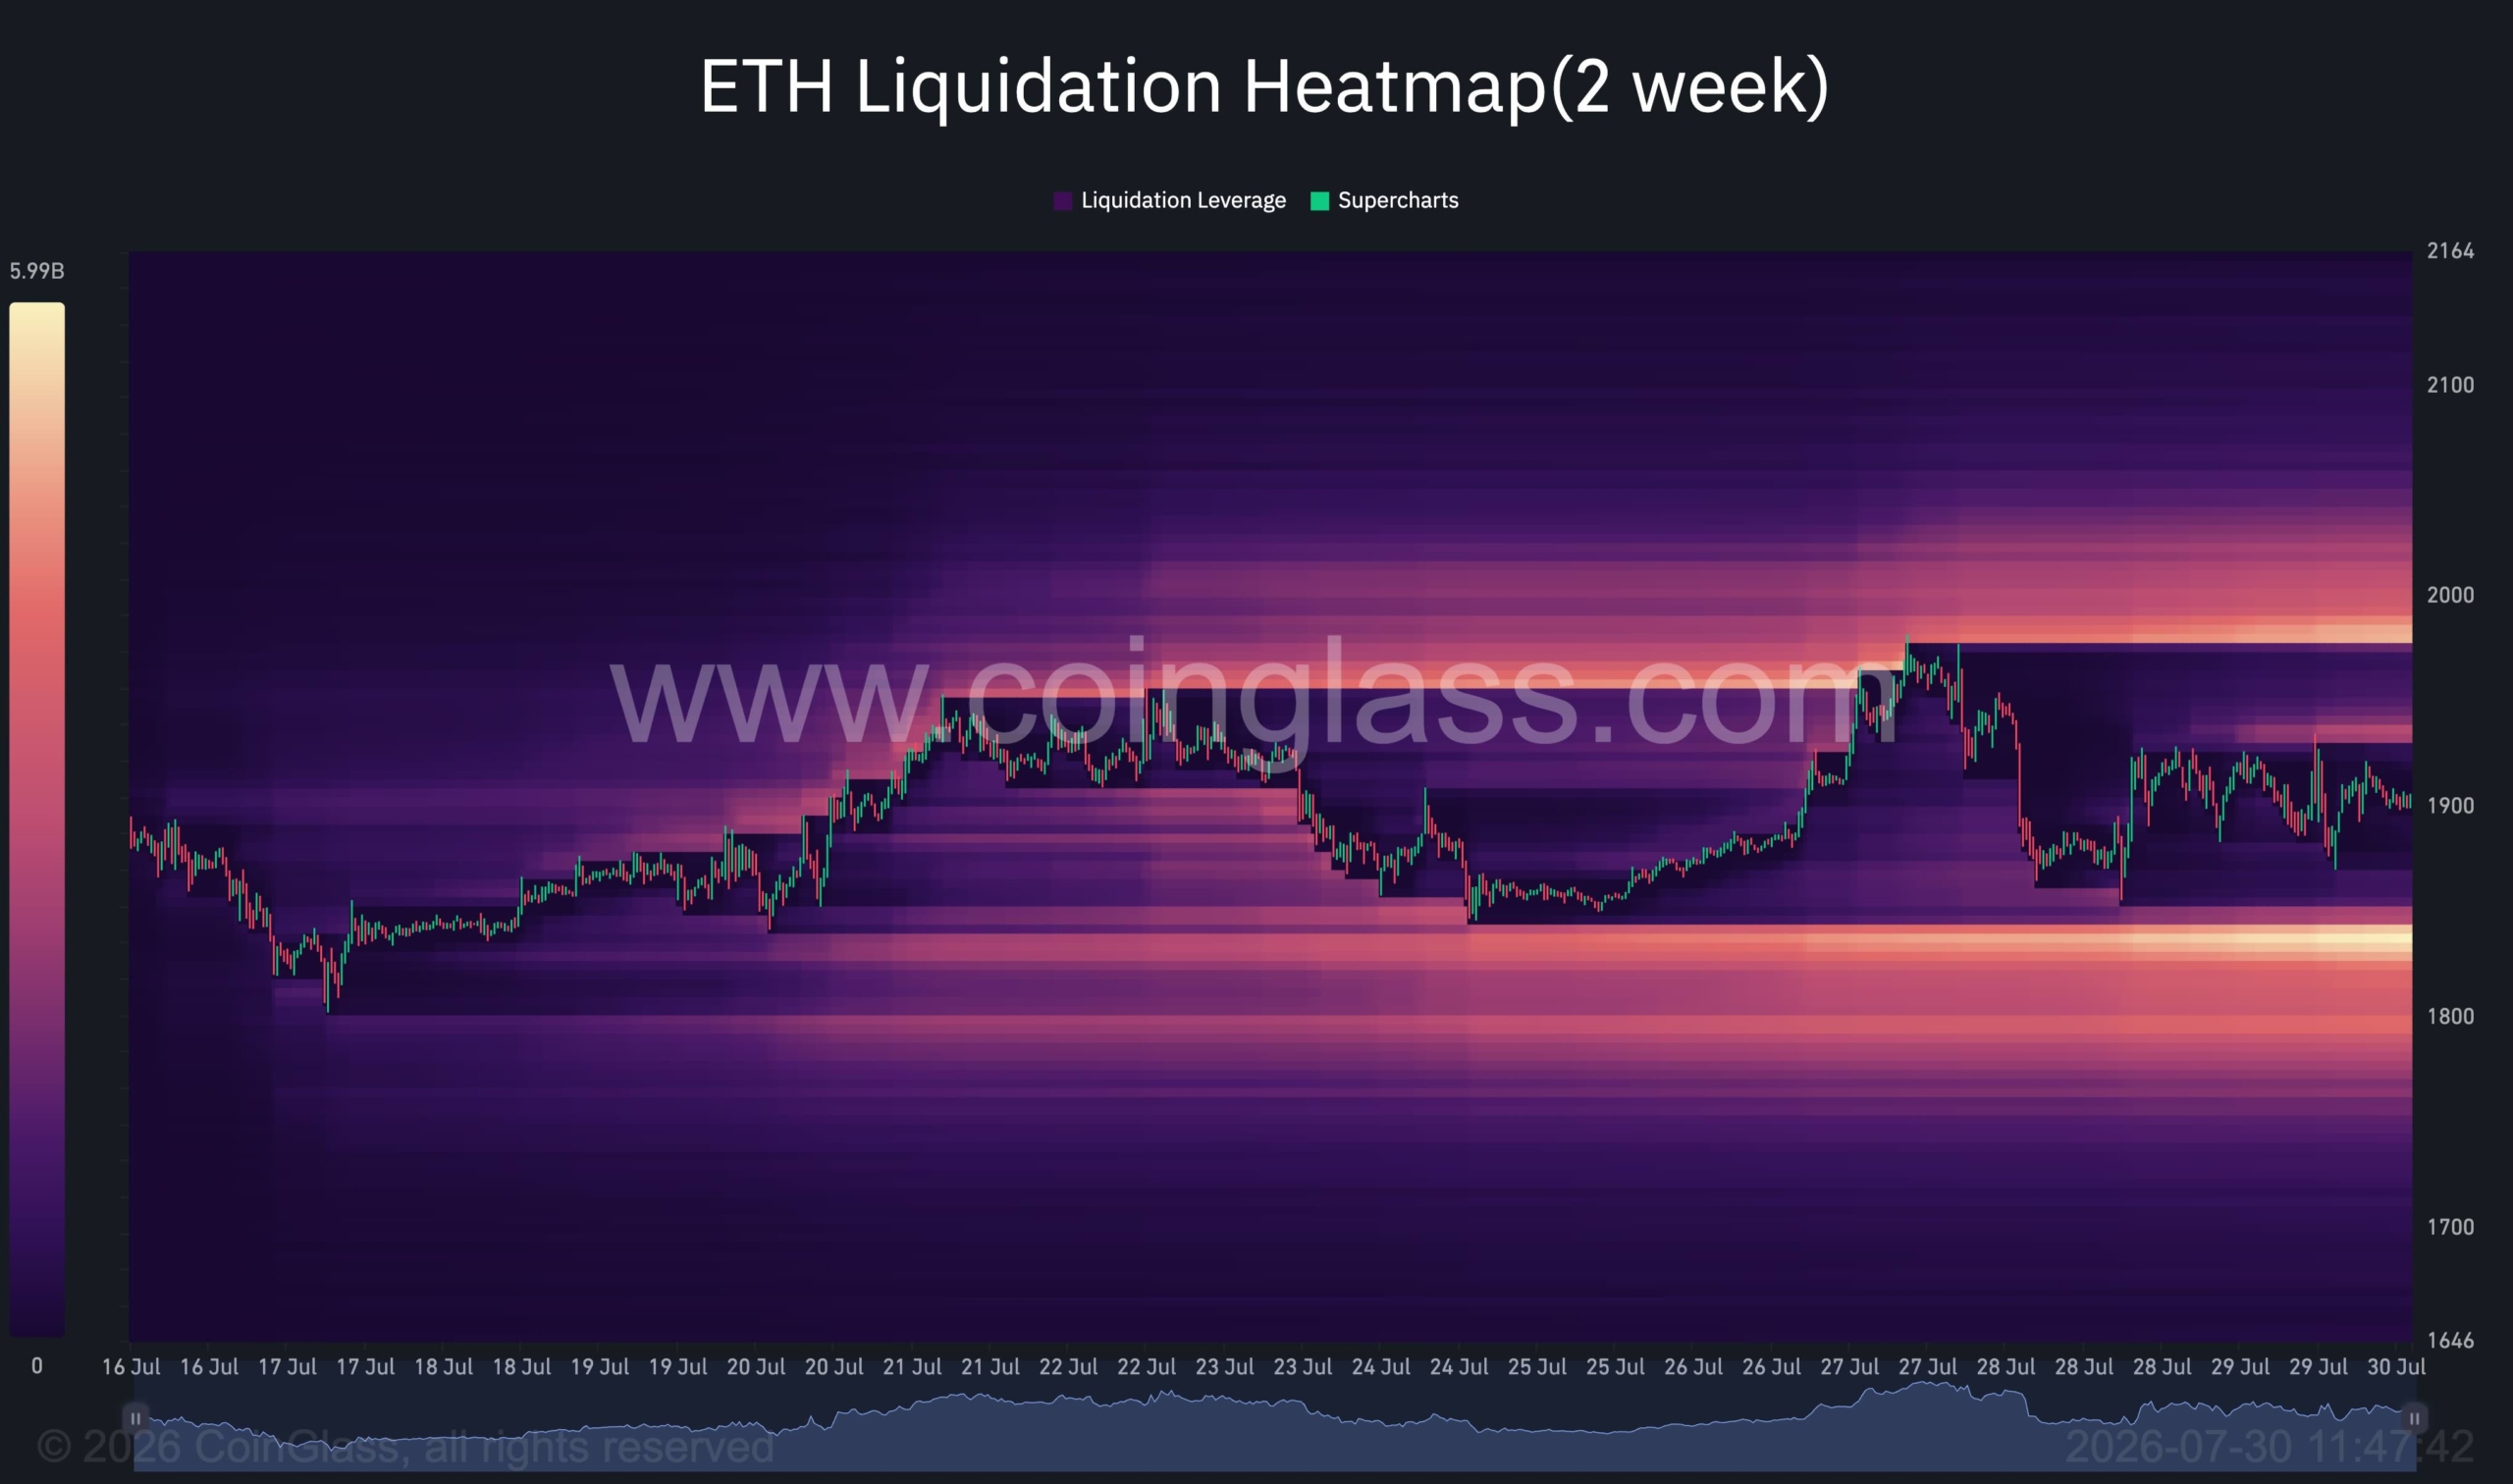
Liquidity Heatmap Tease 🦇
The two week Binance liquidation heatmap shows a thick cluster of liquidity sitting above the current price around the 2000 mark making that the main upside target once buyers reclaim control 🌑.
At the same time a fat liquidation pocket has gathered near the 1820 zone below price. With ETH currently stuck between these two pools it could keep chopping in a range before committing to one of the big liquidity magnets. Sweeping either cluster would unleash fresh volatility as leveraged spots get wiped 🖤.
Just another echo from the void by iconofsin.eth 💖
